What's new: match reports, training reports and the player page
A new way to read matches, trainings and players, and a menu arranged around them. It's on trial with one club first, so if you don't see it, it isn't switched on for your club yet.
Who can use it: admins and coaches. Players see their own numbers in the player app as before.
The pictures on this page use a made-up squad.
The menu
The menu is now arranged by what you're doing rather than where the data comes from. Matches and Training have their own sections, and GPS moves to a small Data section at the bottom. Every page keeps its address, so bookmarks and links still work.
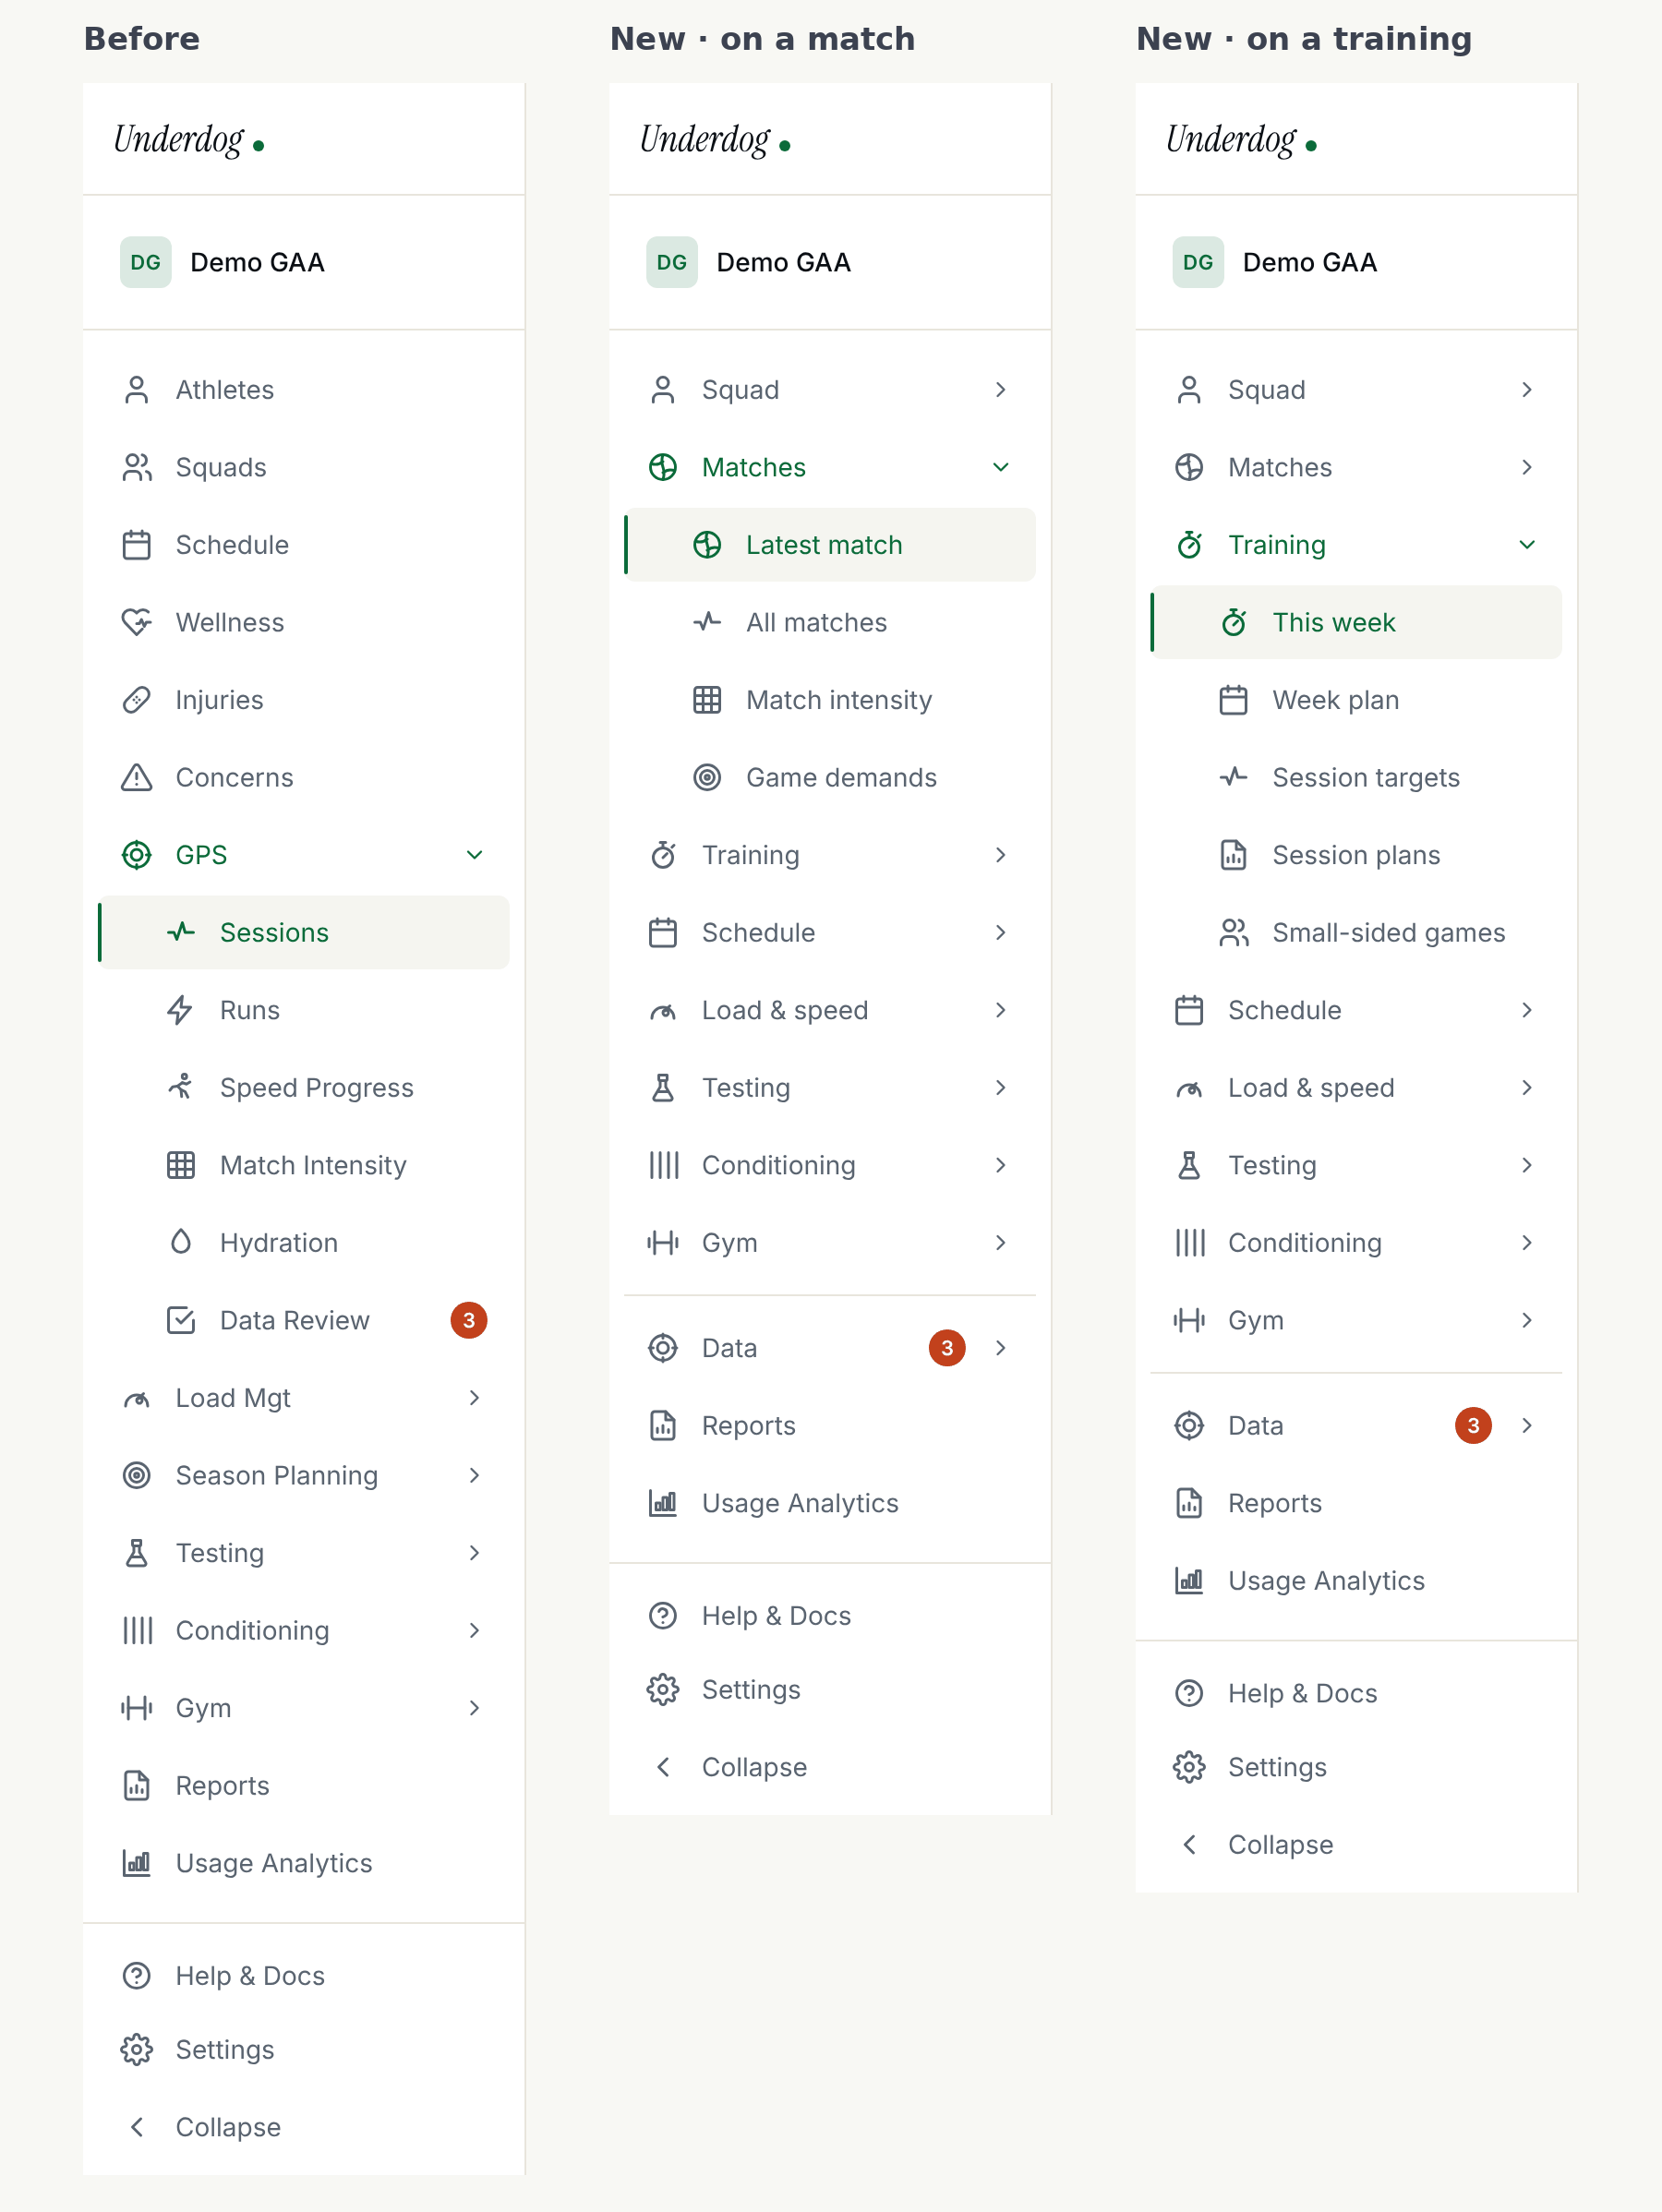
| Section | What's in it |
|---|---|
| Squad | Players, Squads, Concerns, Wellness, Injuries |
| Matches | Latest match (opens the newest match report), All matches, Match intensity, Game demands |
| Training | This week (opens the newest training report), Week plan, Session targets, Session plans, Small-sided games |
| Schedule | Calendar, Season plan |
| Load & speed | Squad load, Top 10 by week, Player analysis, Speed progress, Runs |
| Testing, Conditioning, Gym | As before |
| Data | All recordings (the old GPS → Sessions), Data review, Hydration |
Latest match and This week follow the squad picked in the header. With no match in the last year, or no training in the last ten days, they open the list instead. The Data review count now sits on the Data section.
Where the Today page is on and you have a team role, your short menu also gets Latest match (managers, S&C coaches and analysts) and This week's training (managers and S&C coaches).
Match report
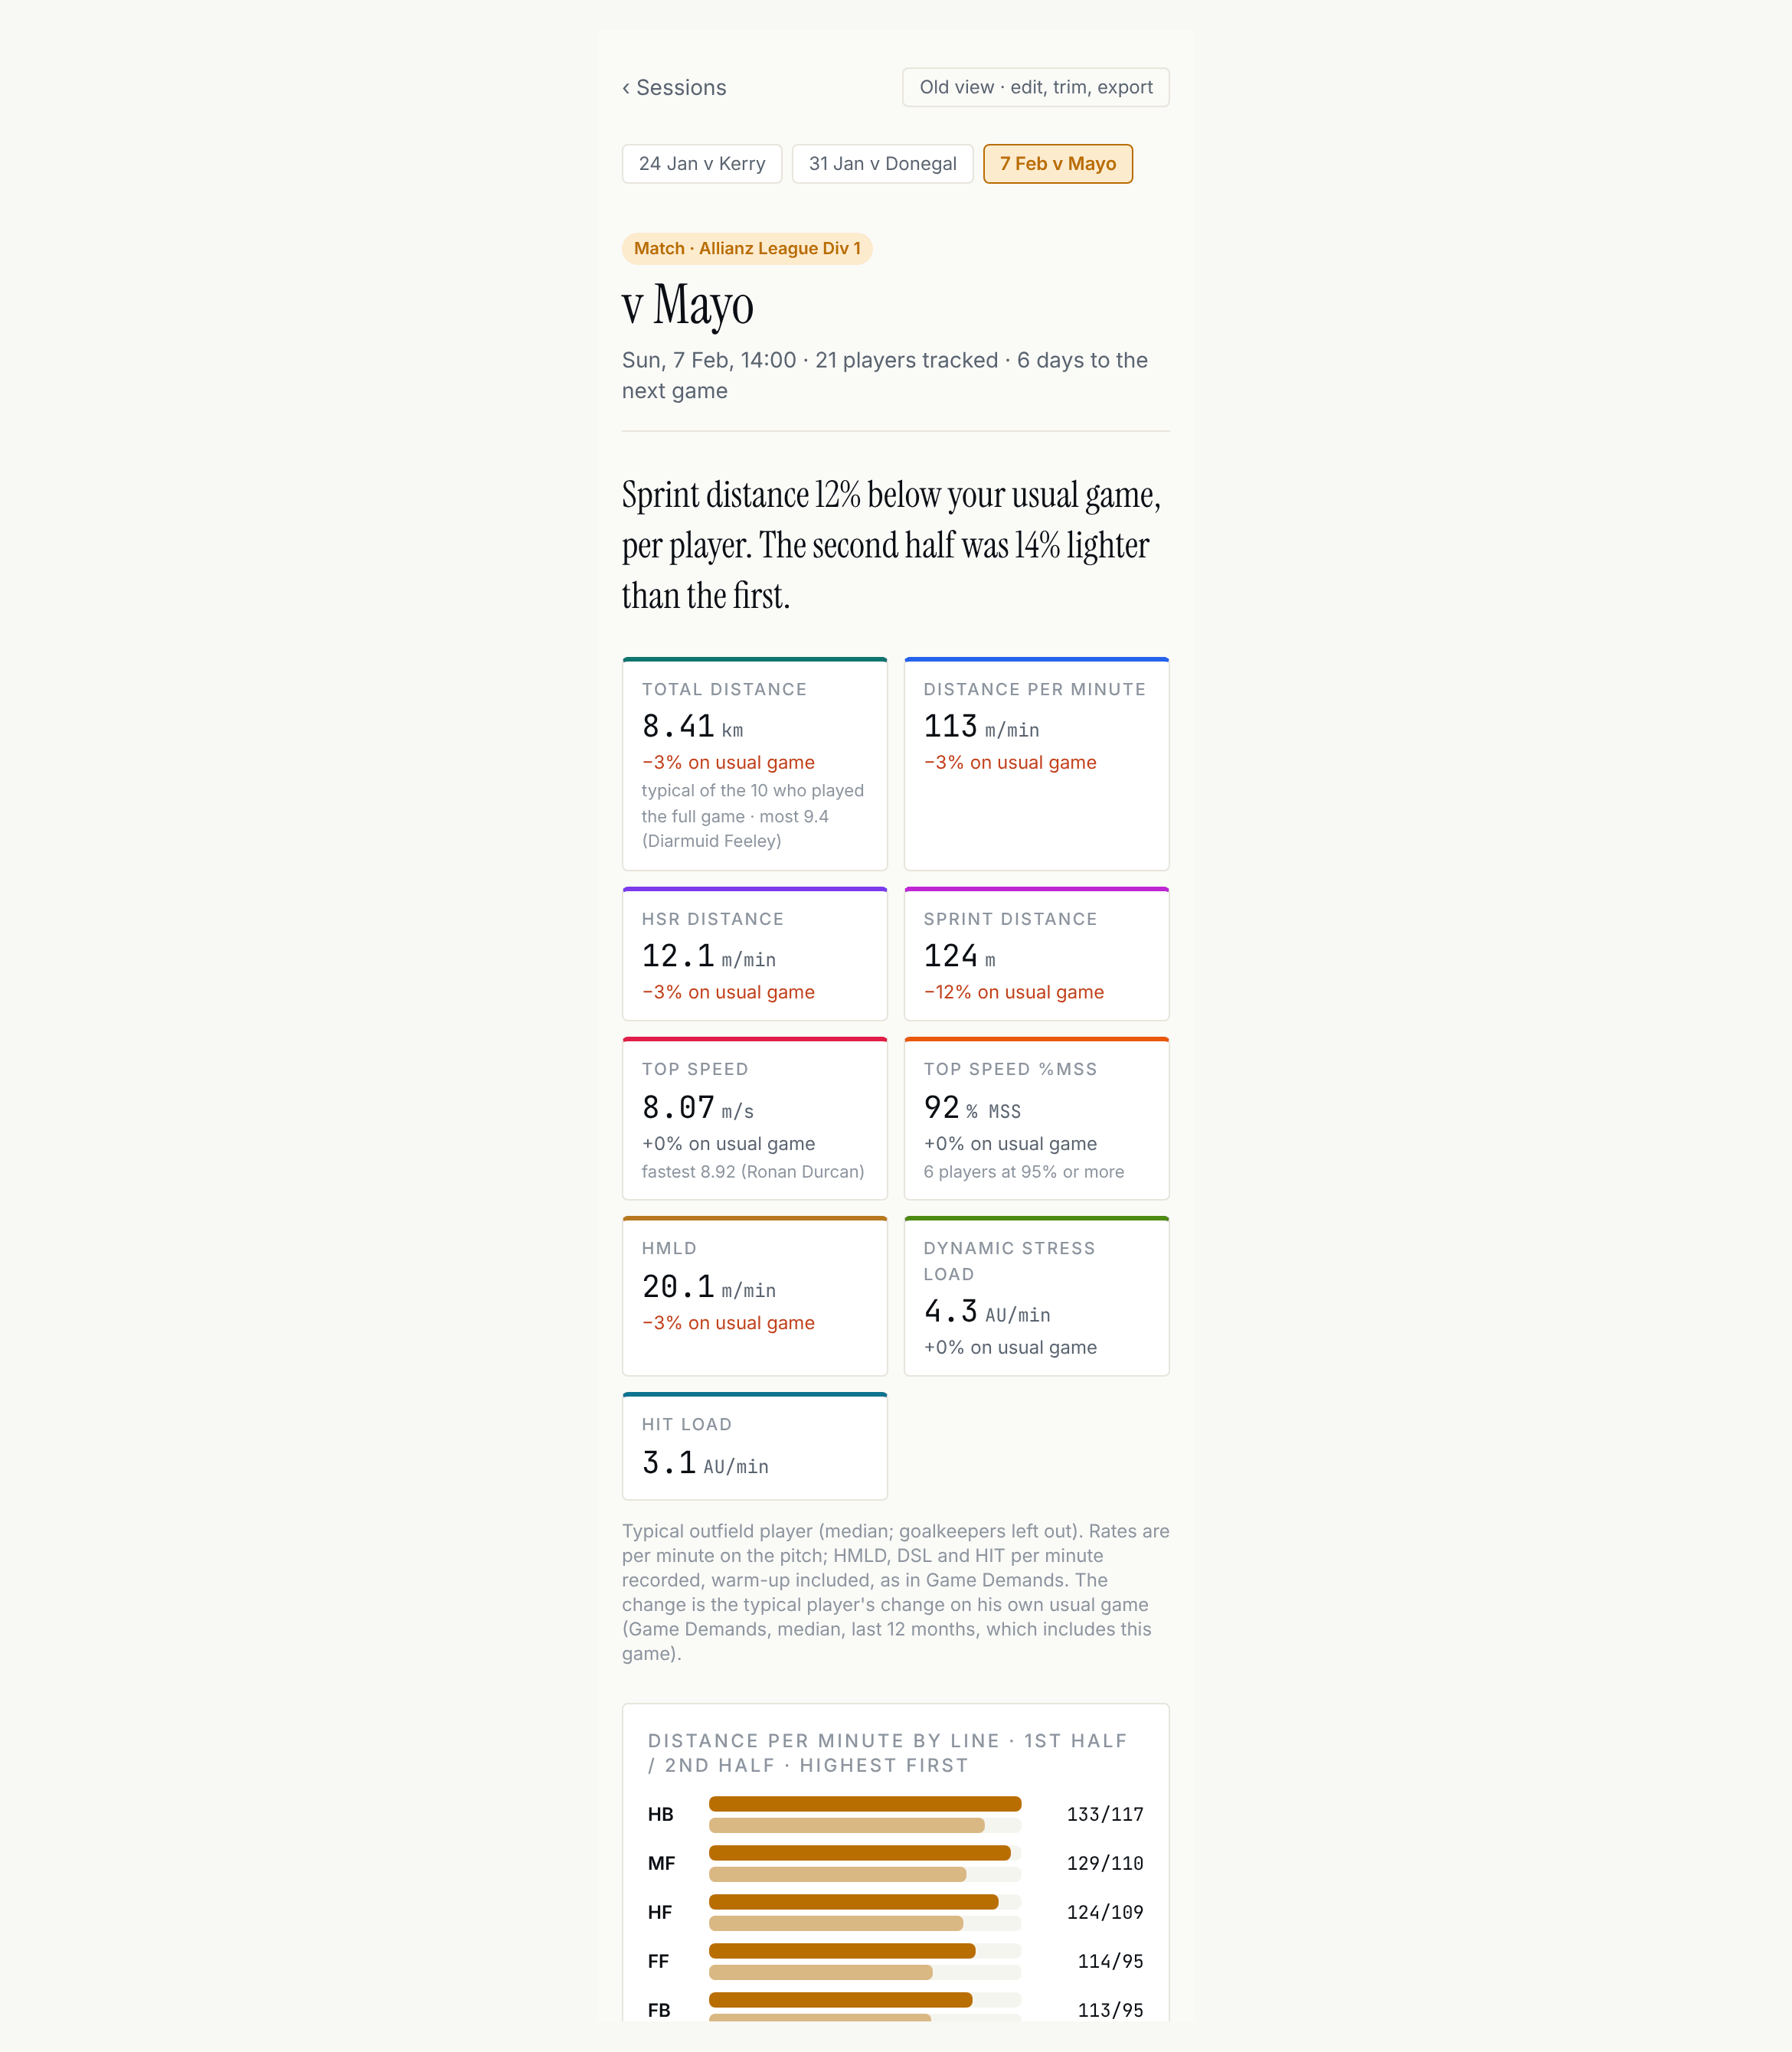
Open any match from Matches or the list. The report leads with one sentence on how the game went and the season's fixtures across the top, so you can step between games. The ‹ and › buttons at the top (or the left and right arrow keys) go to the previous or next game.
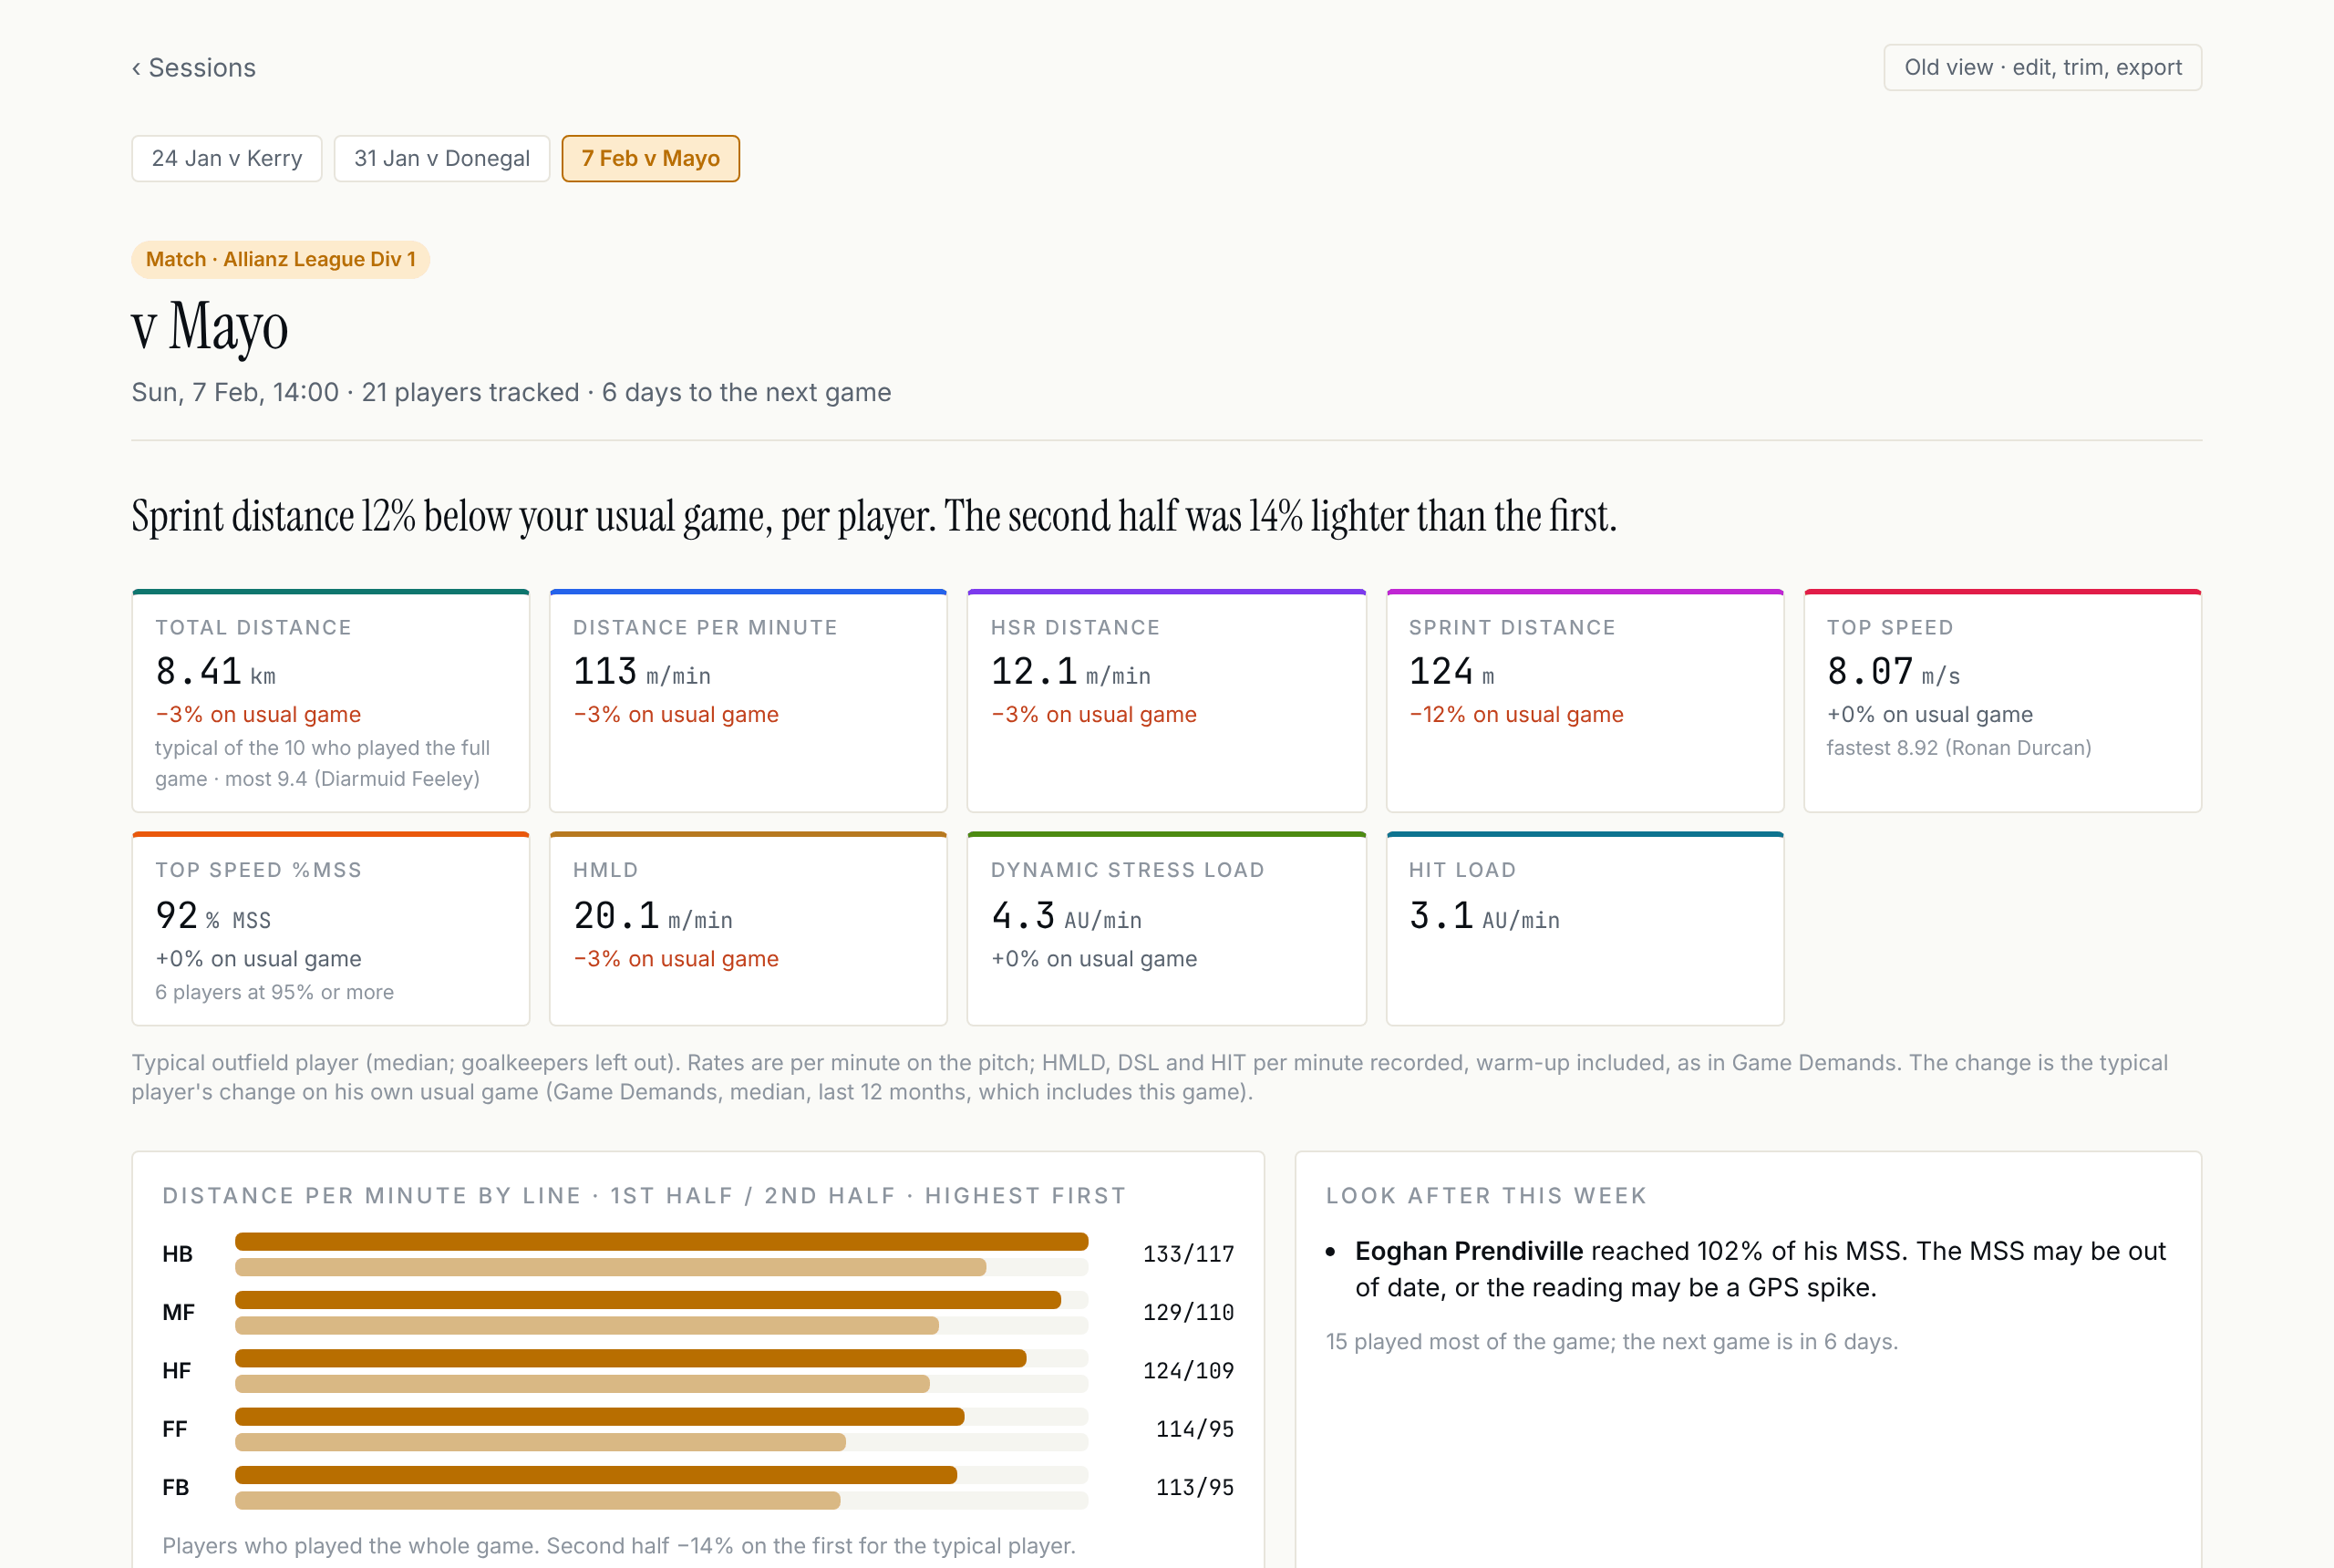
- The tiles show the typical outfield player (the median), and how much that's up or down on each player's own usual game.
- Distance per minute by line compares the first half with the second, for players who played the whole game.
- Look after this week names anyone who went past his max speed, and players who carried a heavy game into a short week.
- Goalkeepers are left out of squad figures. Per-minute rates need 20 minutes on the pitch, so a short sub doesn't top the table.
- If nobody marked the halves, minutes on the pitch aren't known, so the per-minute figures are hidden and the page links to Match timing.
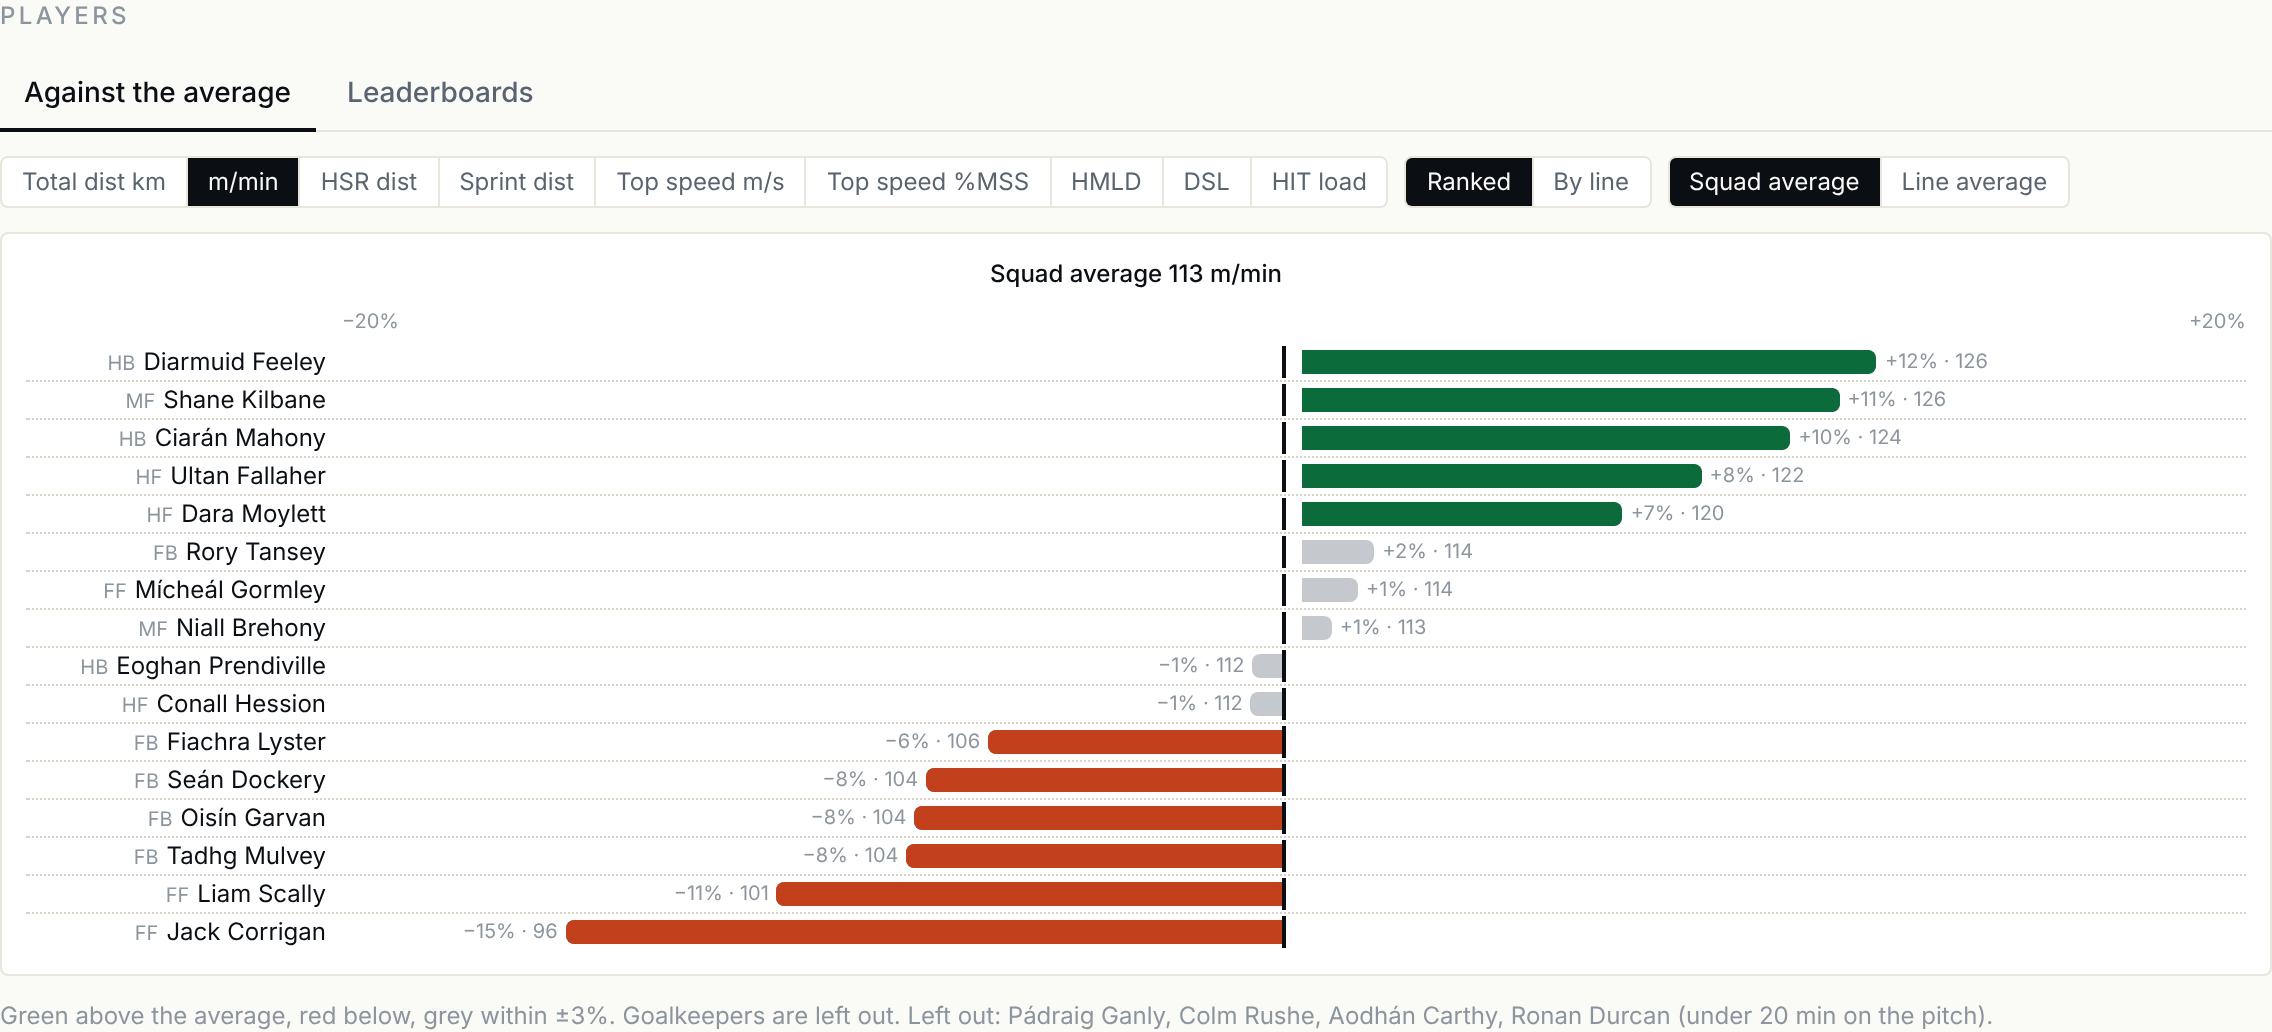
Players has two views. Against the average draws each player against the squad (or his line) on the metric you pick:
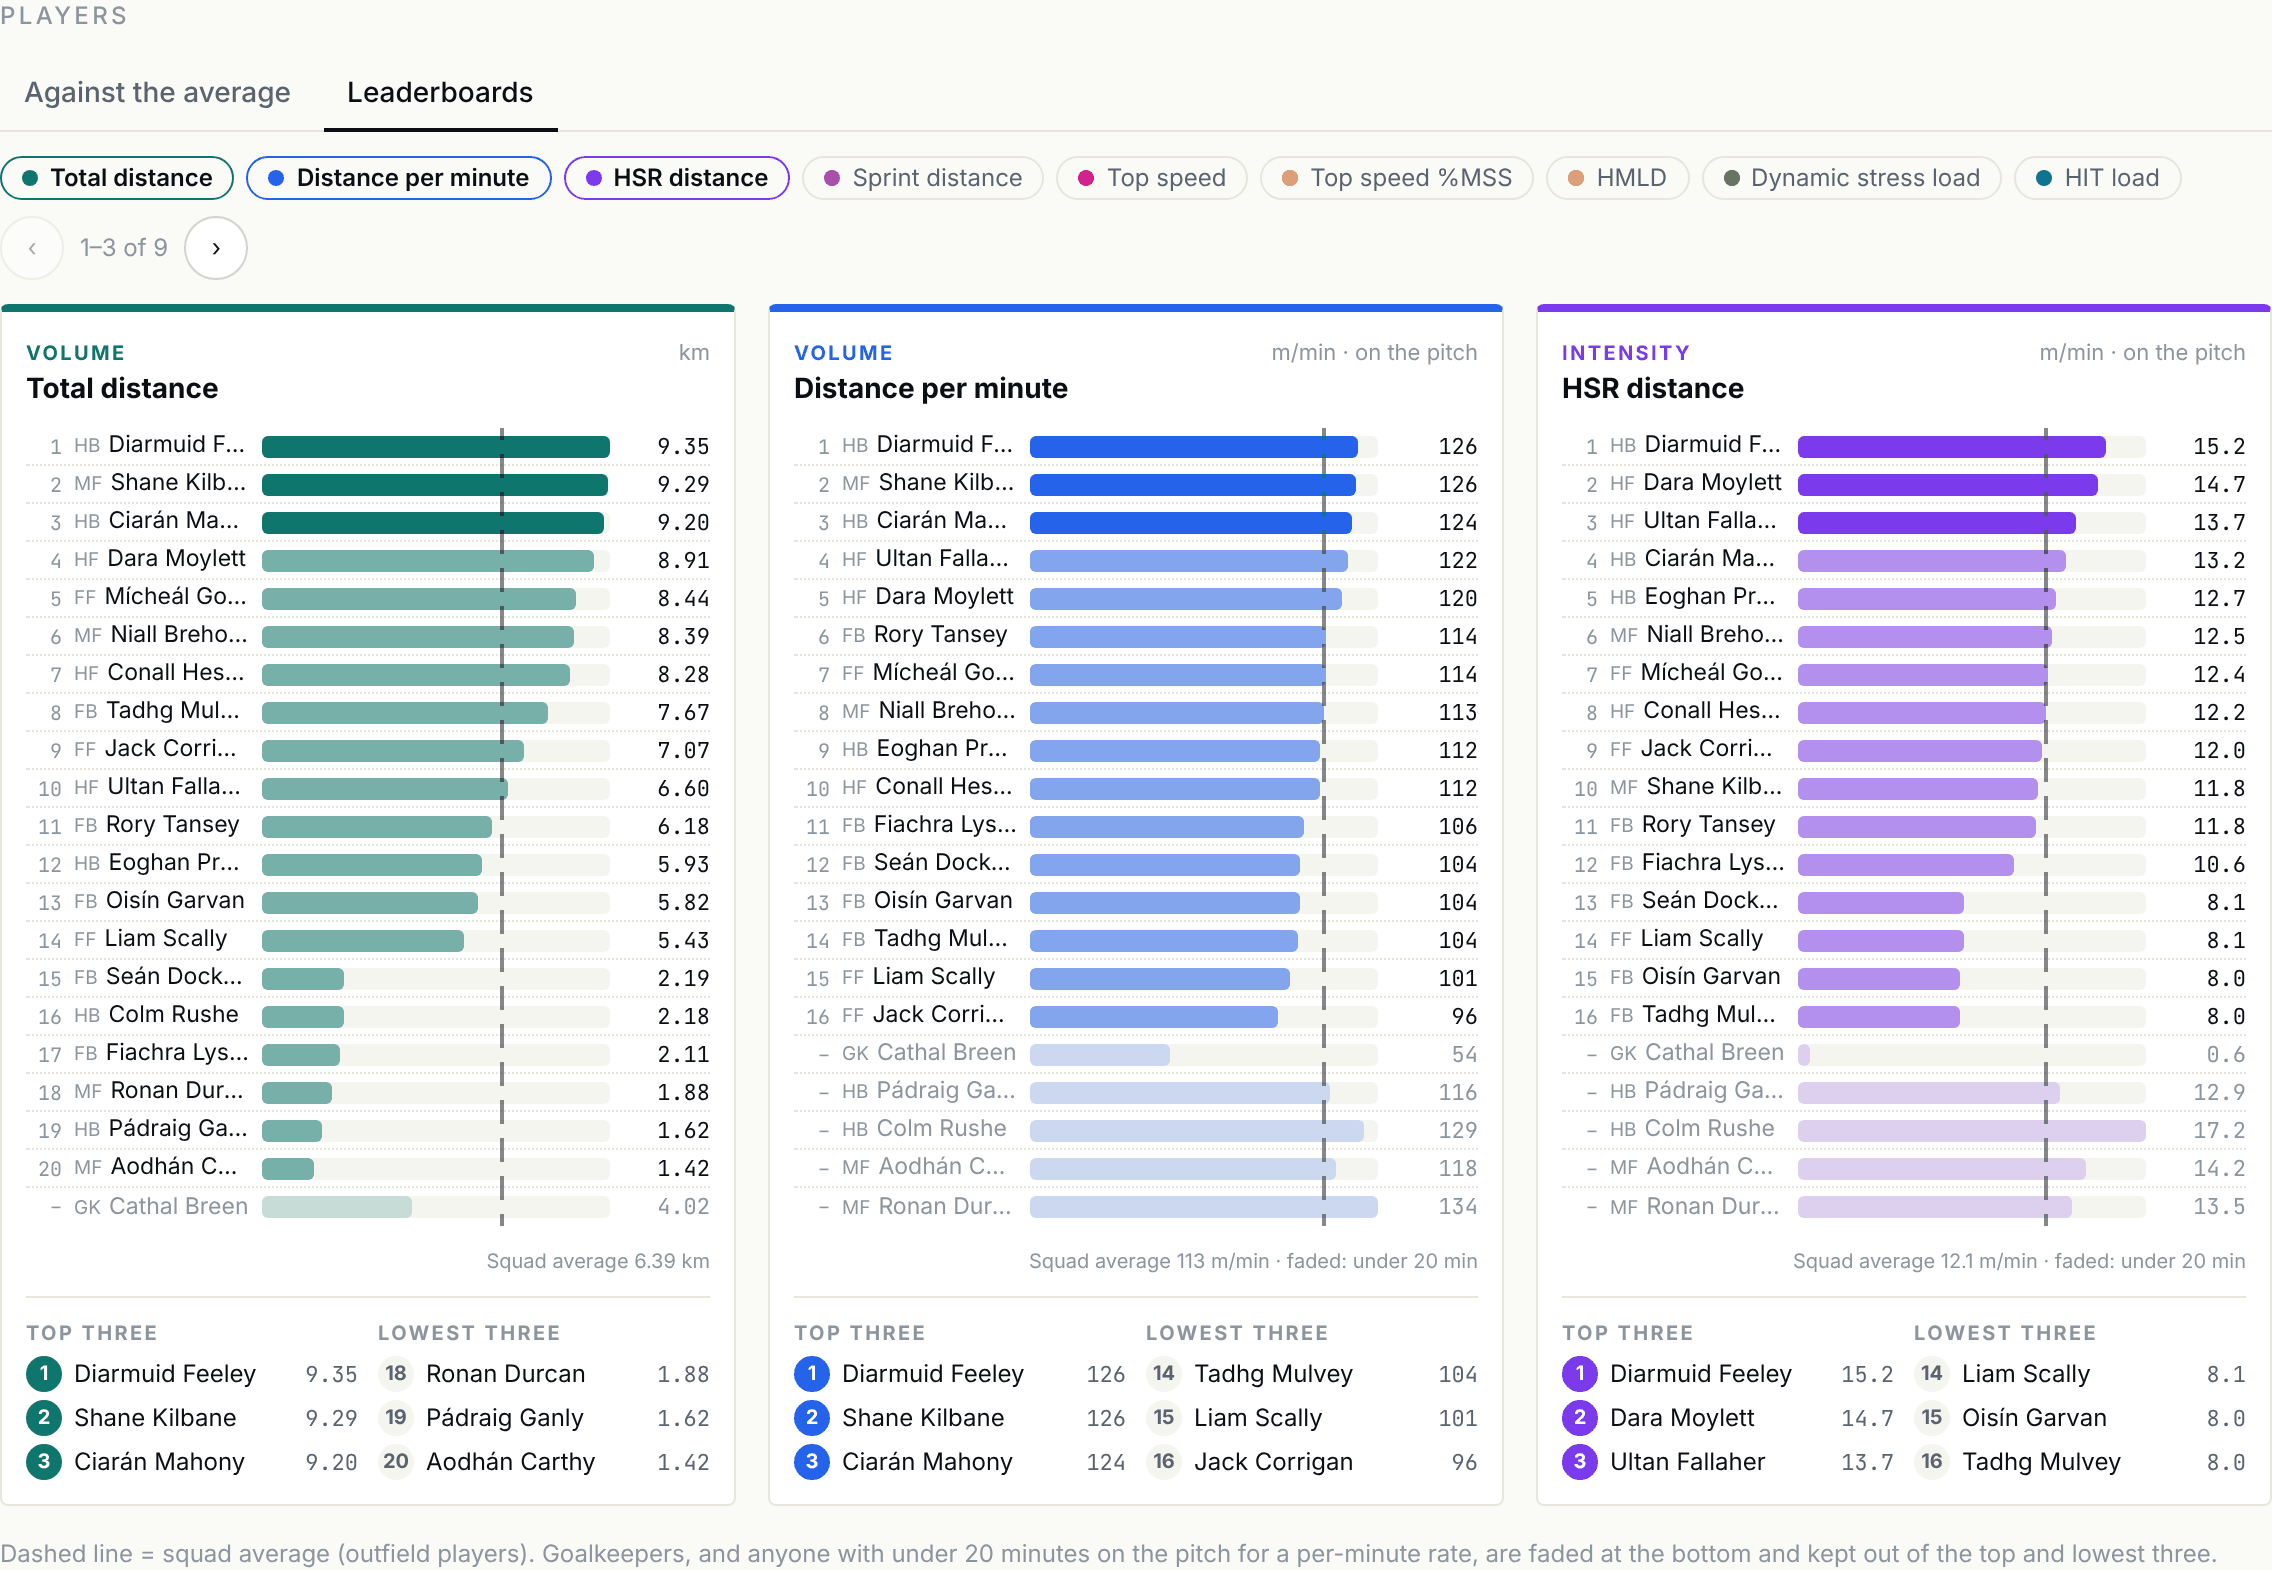
Leaderboards puts each metric on its own card, with the top and lowest three:
On a phone the page is one column, with the sentence first:
Training report
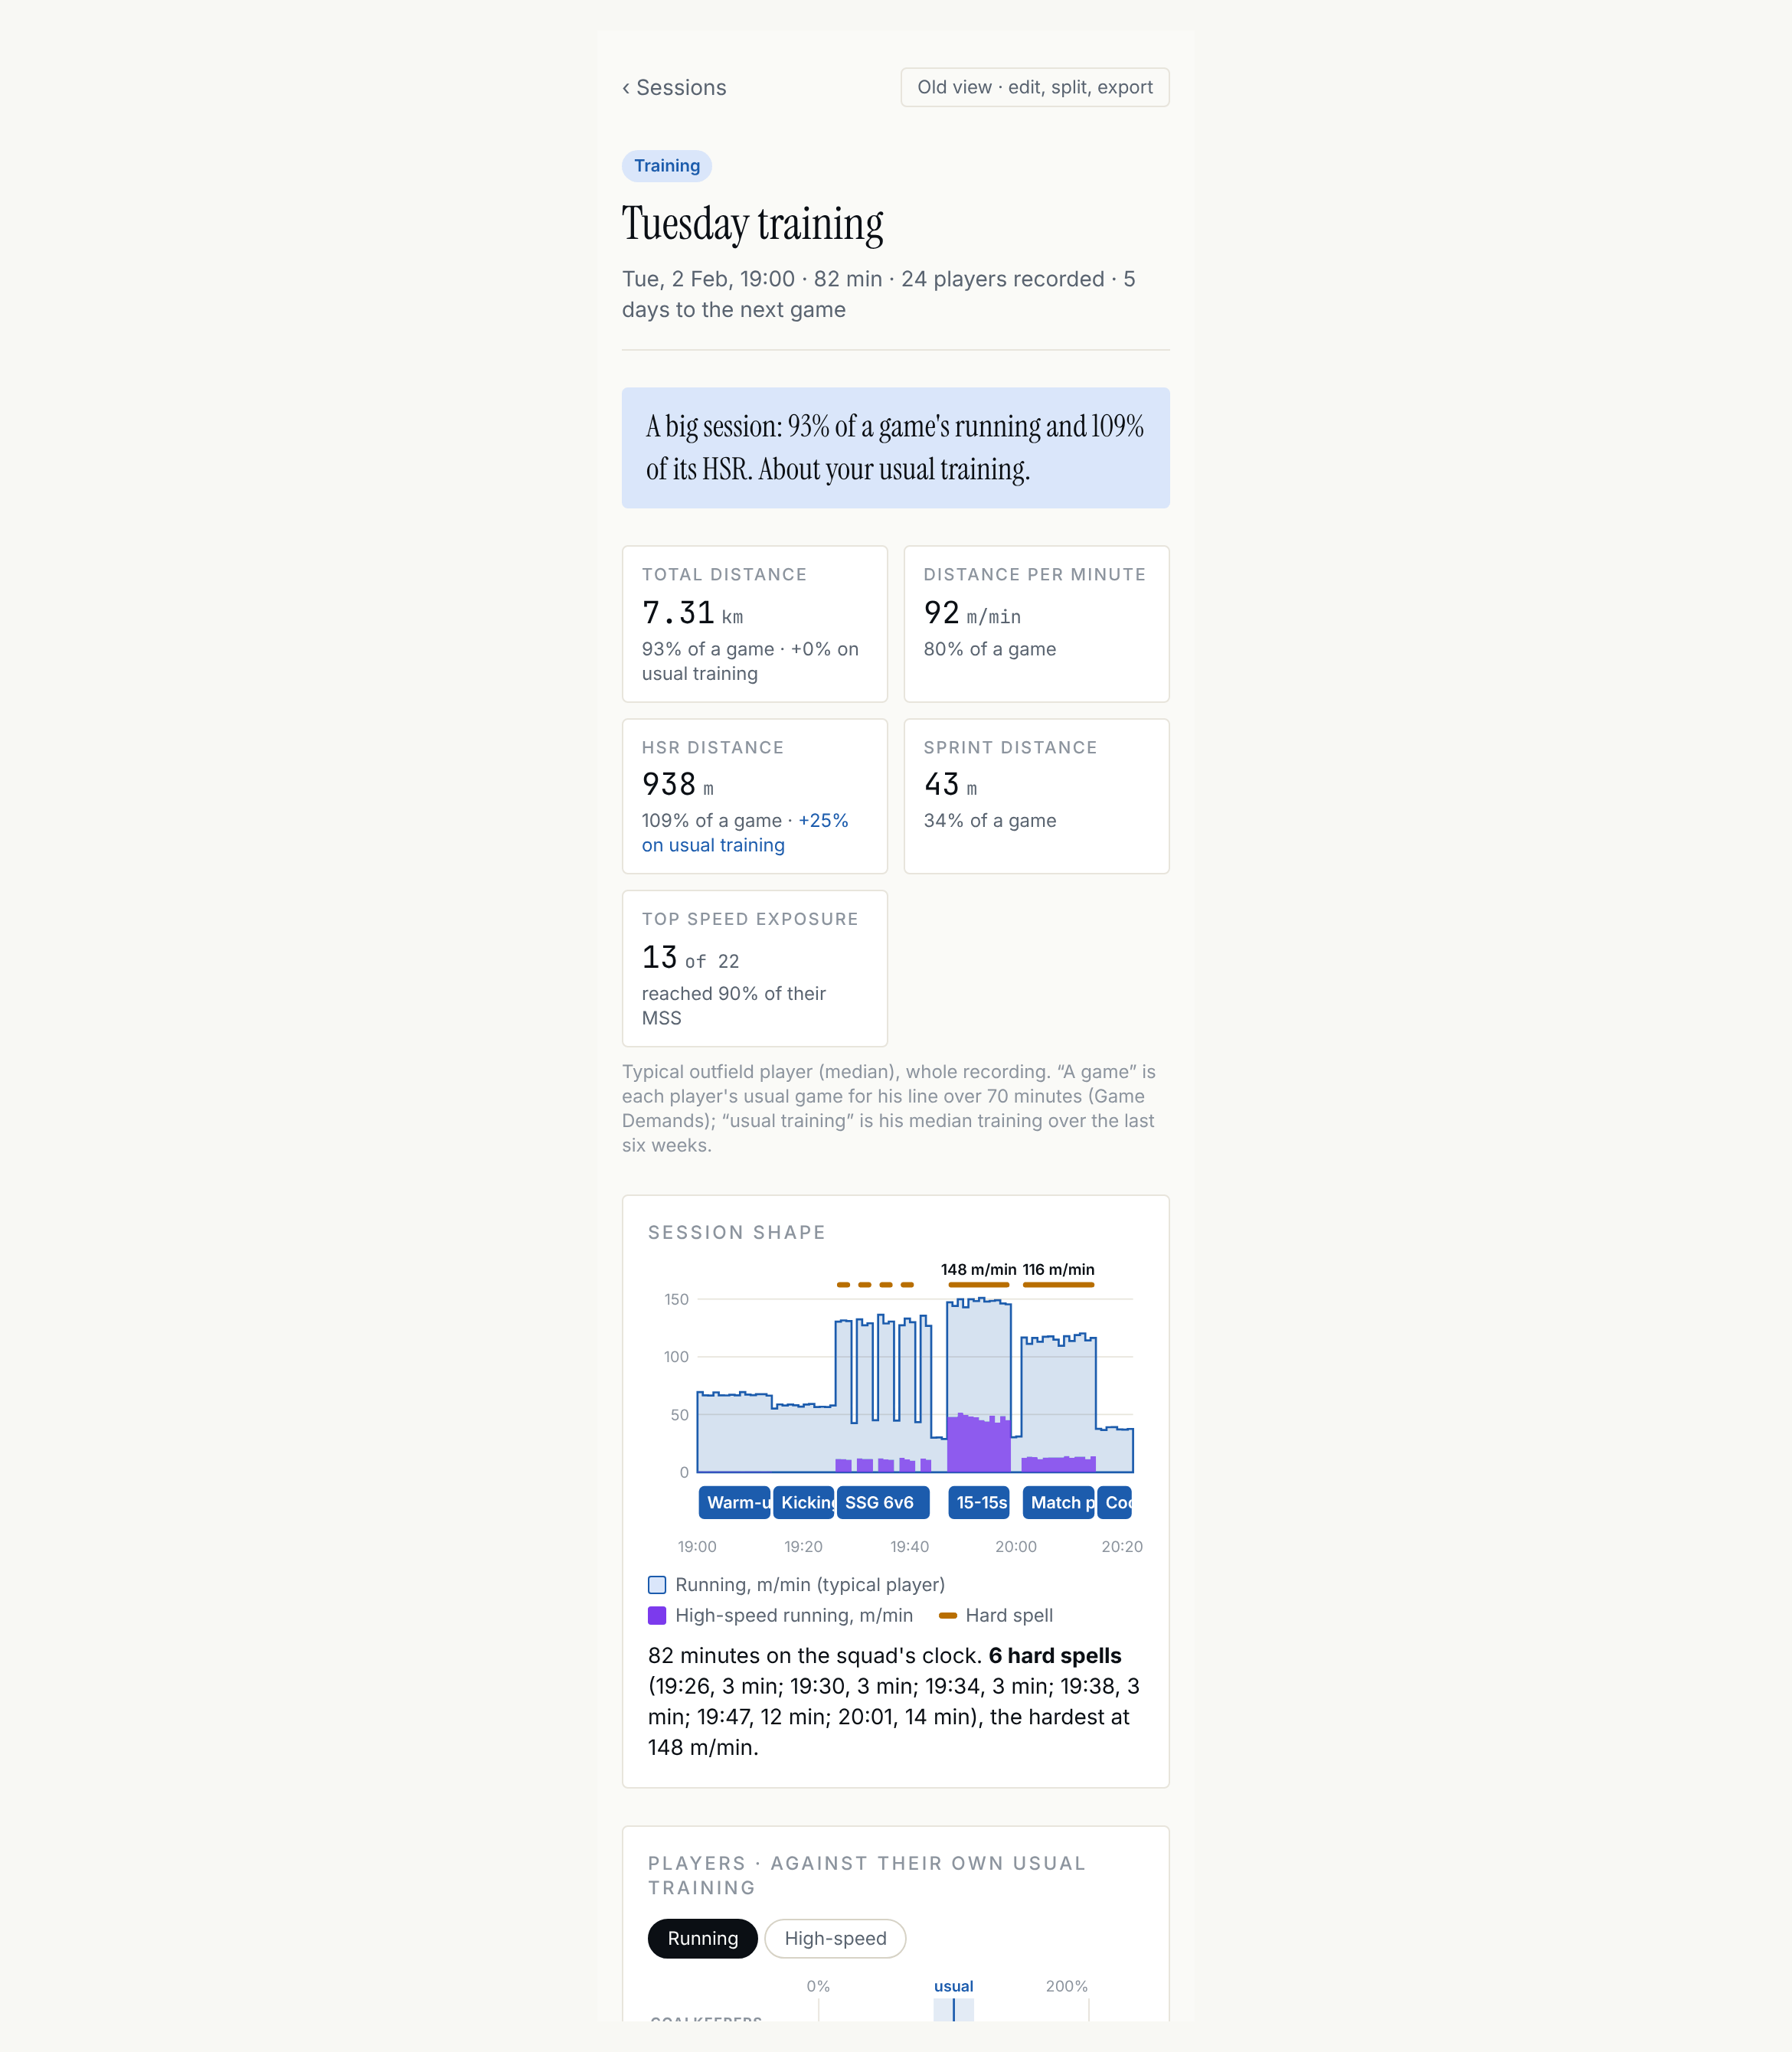
Open a training from Training → This week or the list. It works for a planned session and for one nobody put on the schedule. The ‹ and › buttons at the top (or the left and right arrow keys) step to the previous or next session. When there's a plan, the session's goals and plan against actual appear as before.
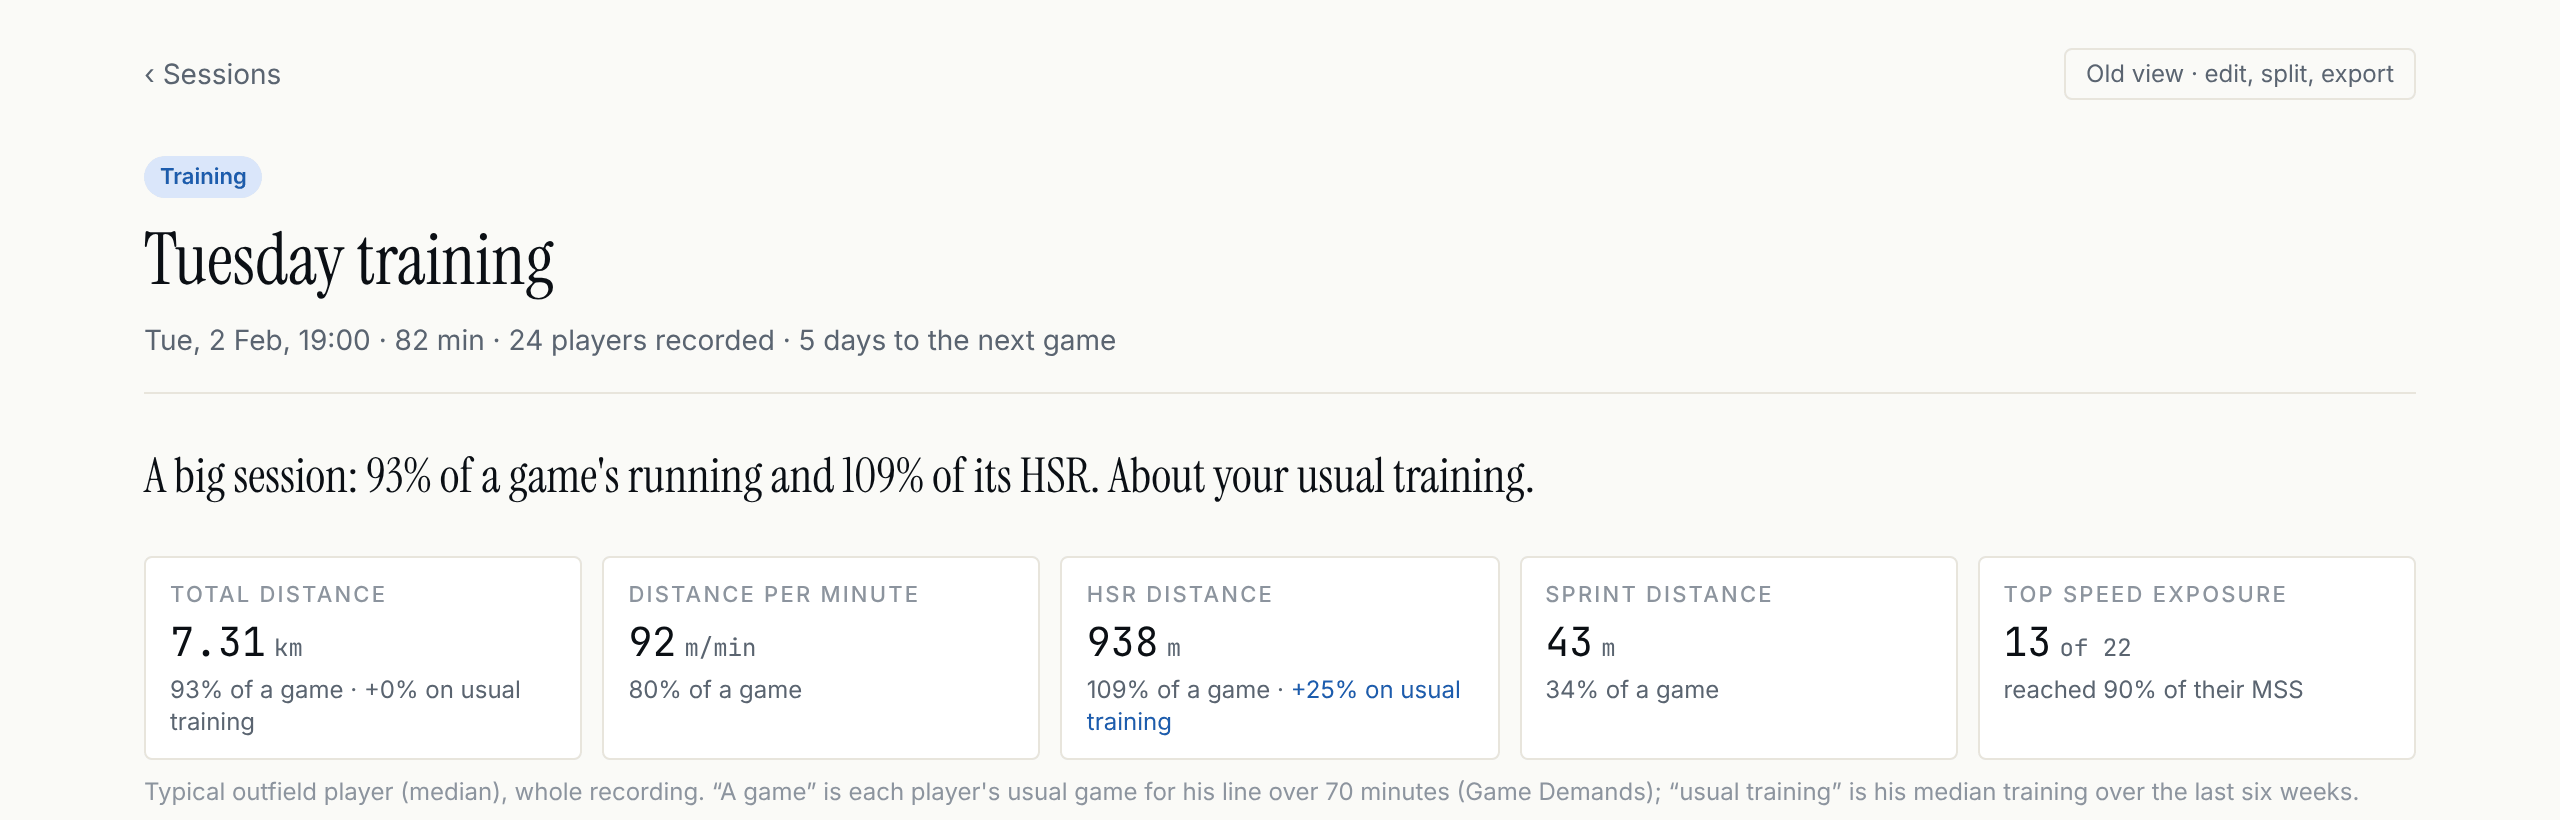
The tiles compare the session with a game (each player's usual game for his line) and with his usual training (his median training over the last six weeks).
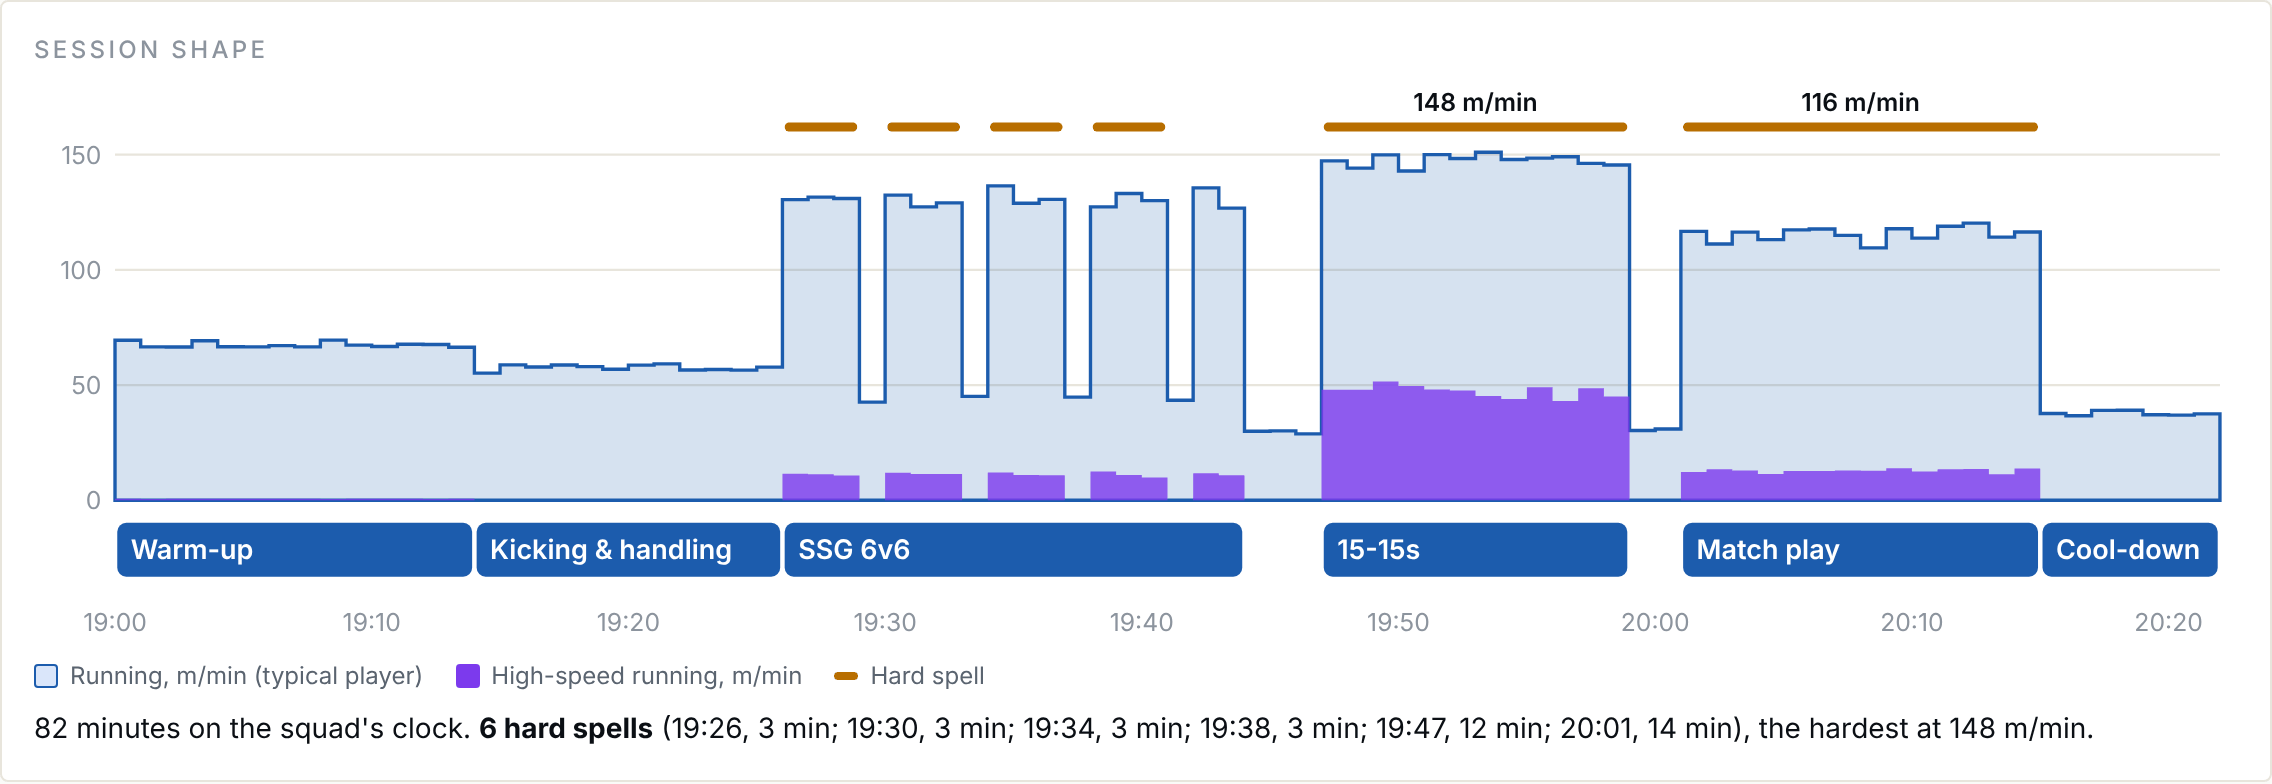
Session shape draws the typical player's running minute by minute, with high-speed running inside it. A hard spell is three minutes or more well above the session's typical minute. The activity blocks sit underneath when the session was split; otherwise you're offered a link to add the split.
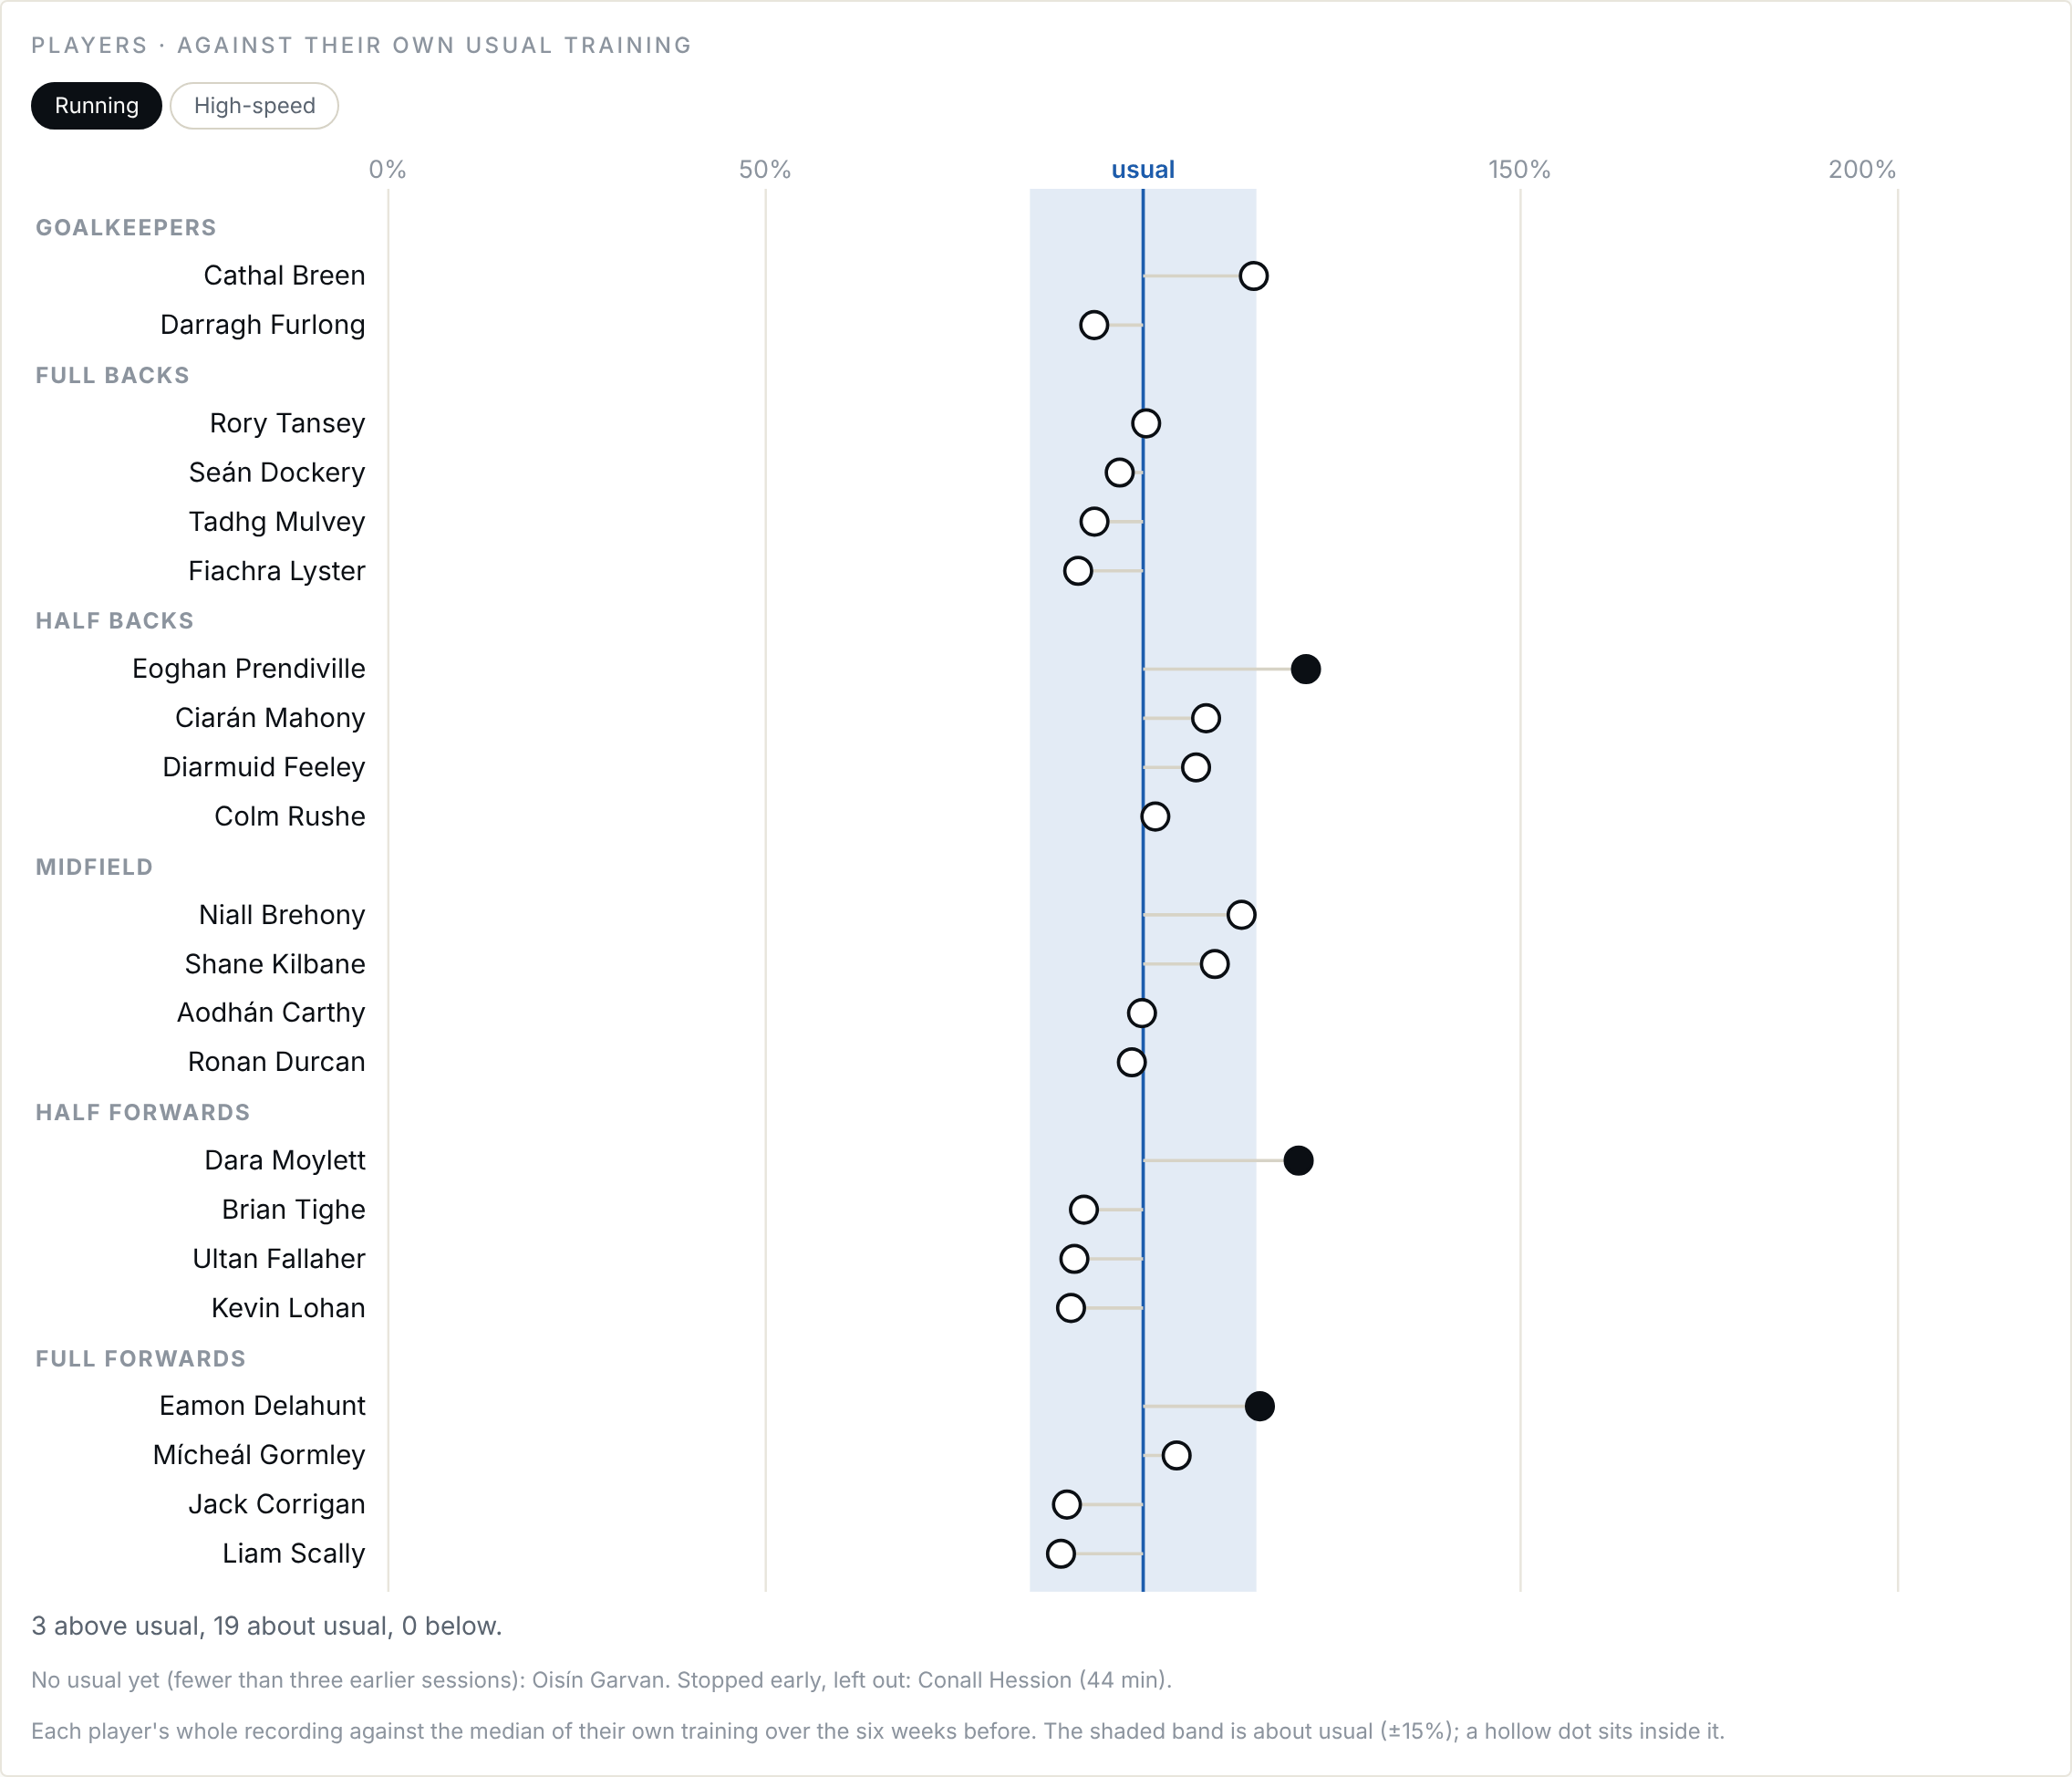
Players against their own usual training puts a dot at each player's running today as a share of his usual. Inside the shaded band (±15%) is about usual. Switch to High-speed for HSR. Players with no usual yet, or whose unit stopped early, are listed underneath.
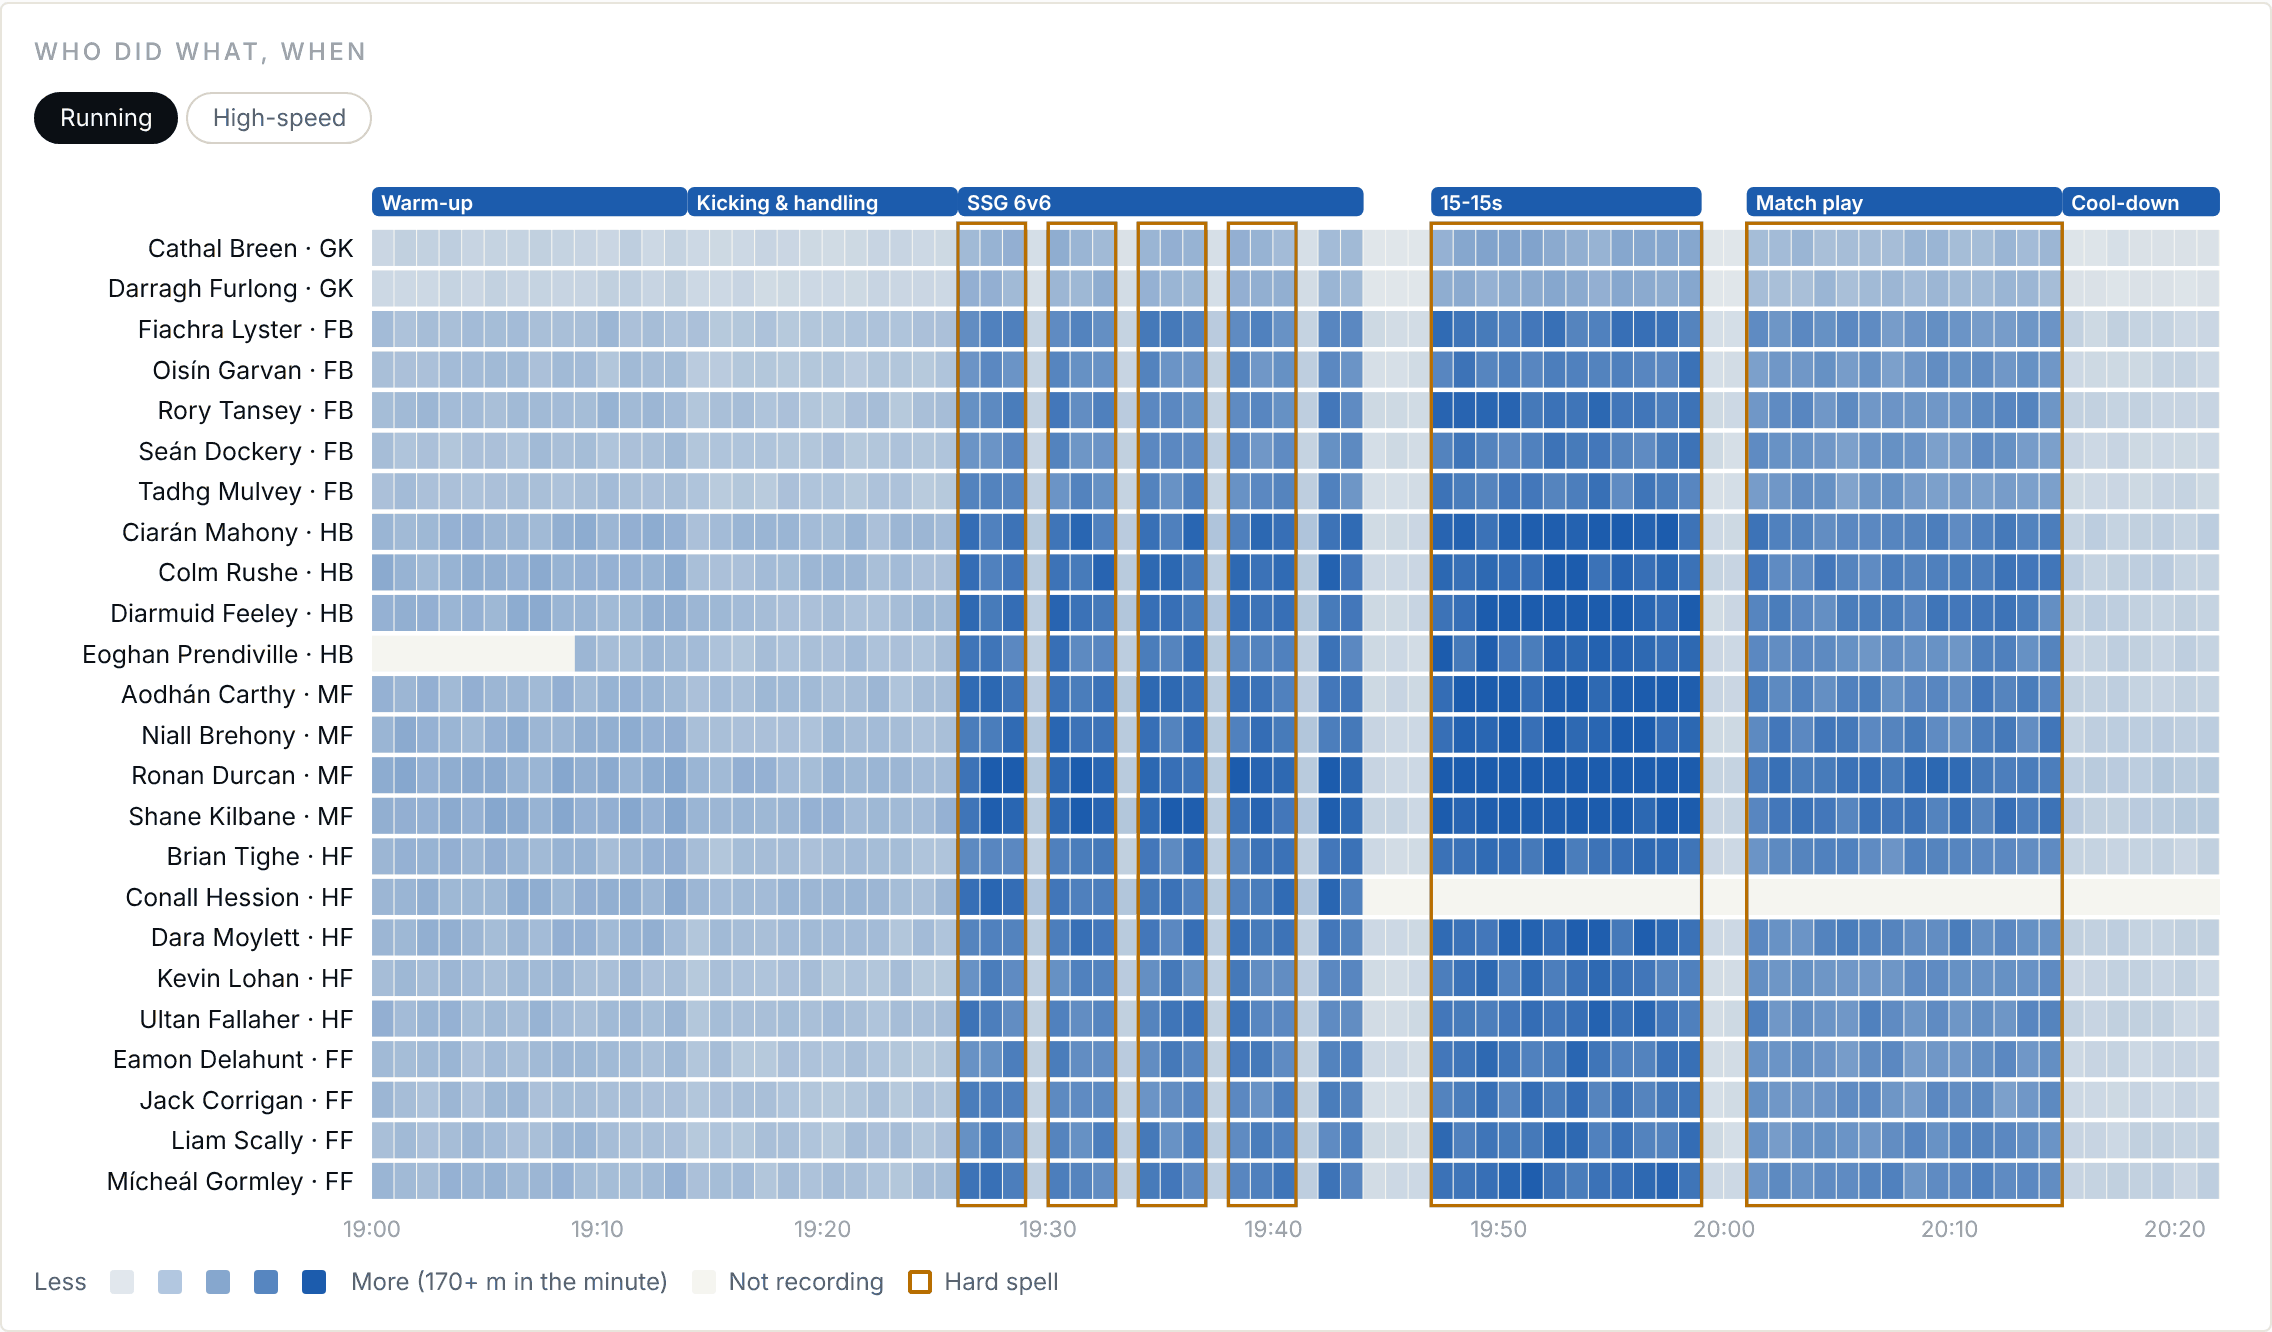
Who did what, when has a row per player and a column per minute, so late arrivals, early finishes and who carried the hard spells show at a glance.
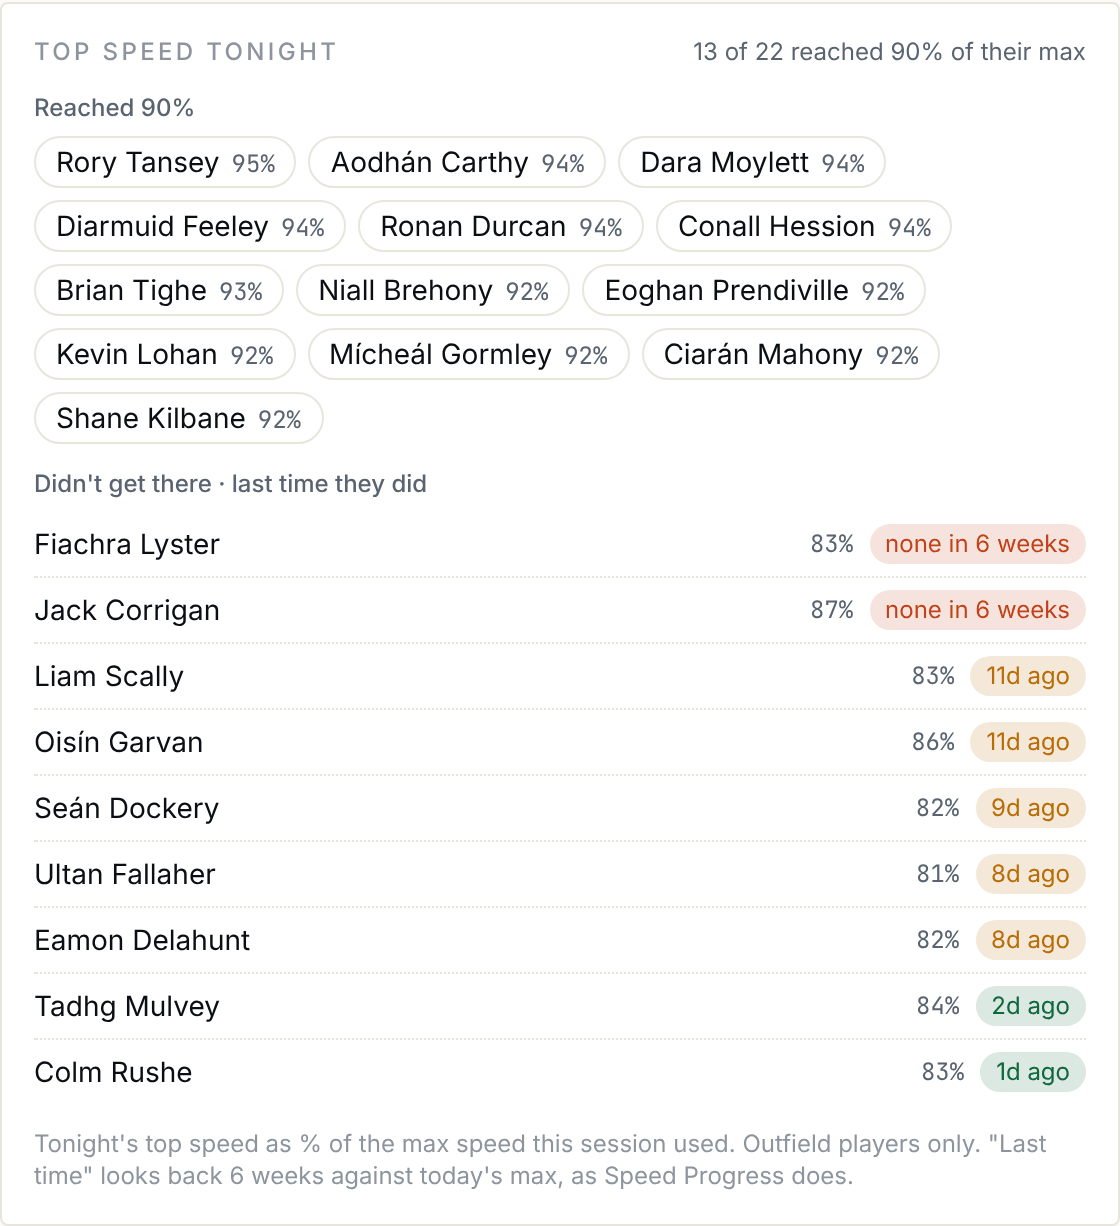
Top speed tonight lists who reached 90% of his max speed and who didn't, with how long since each of the others last did. The longest overdue come first, so it doubles as a list for the next speed session.
Player page
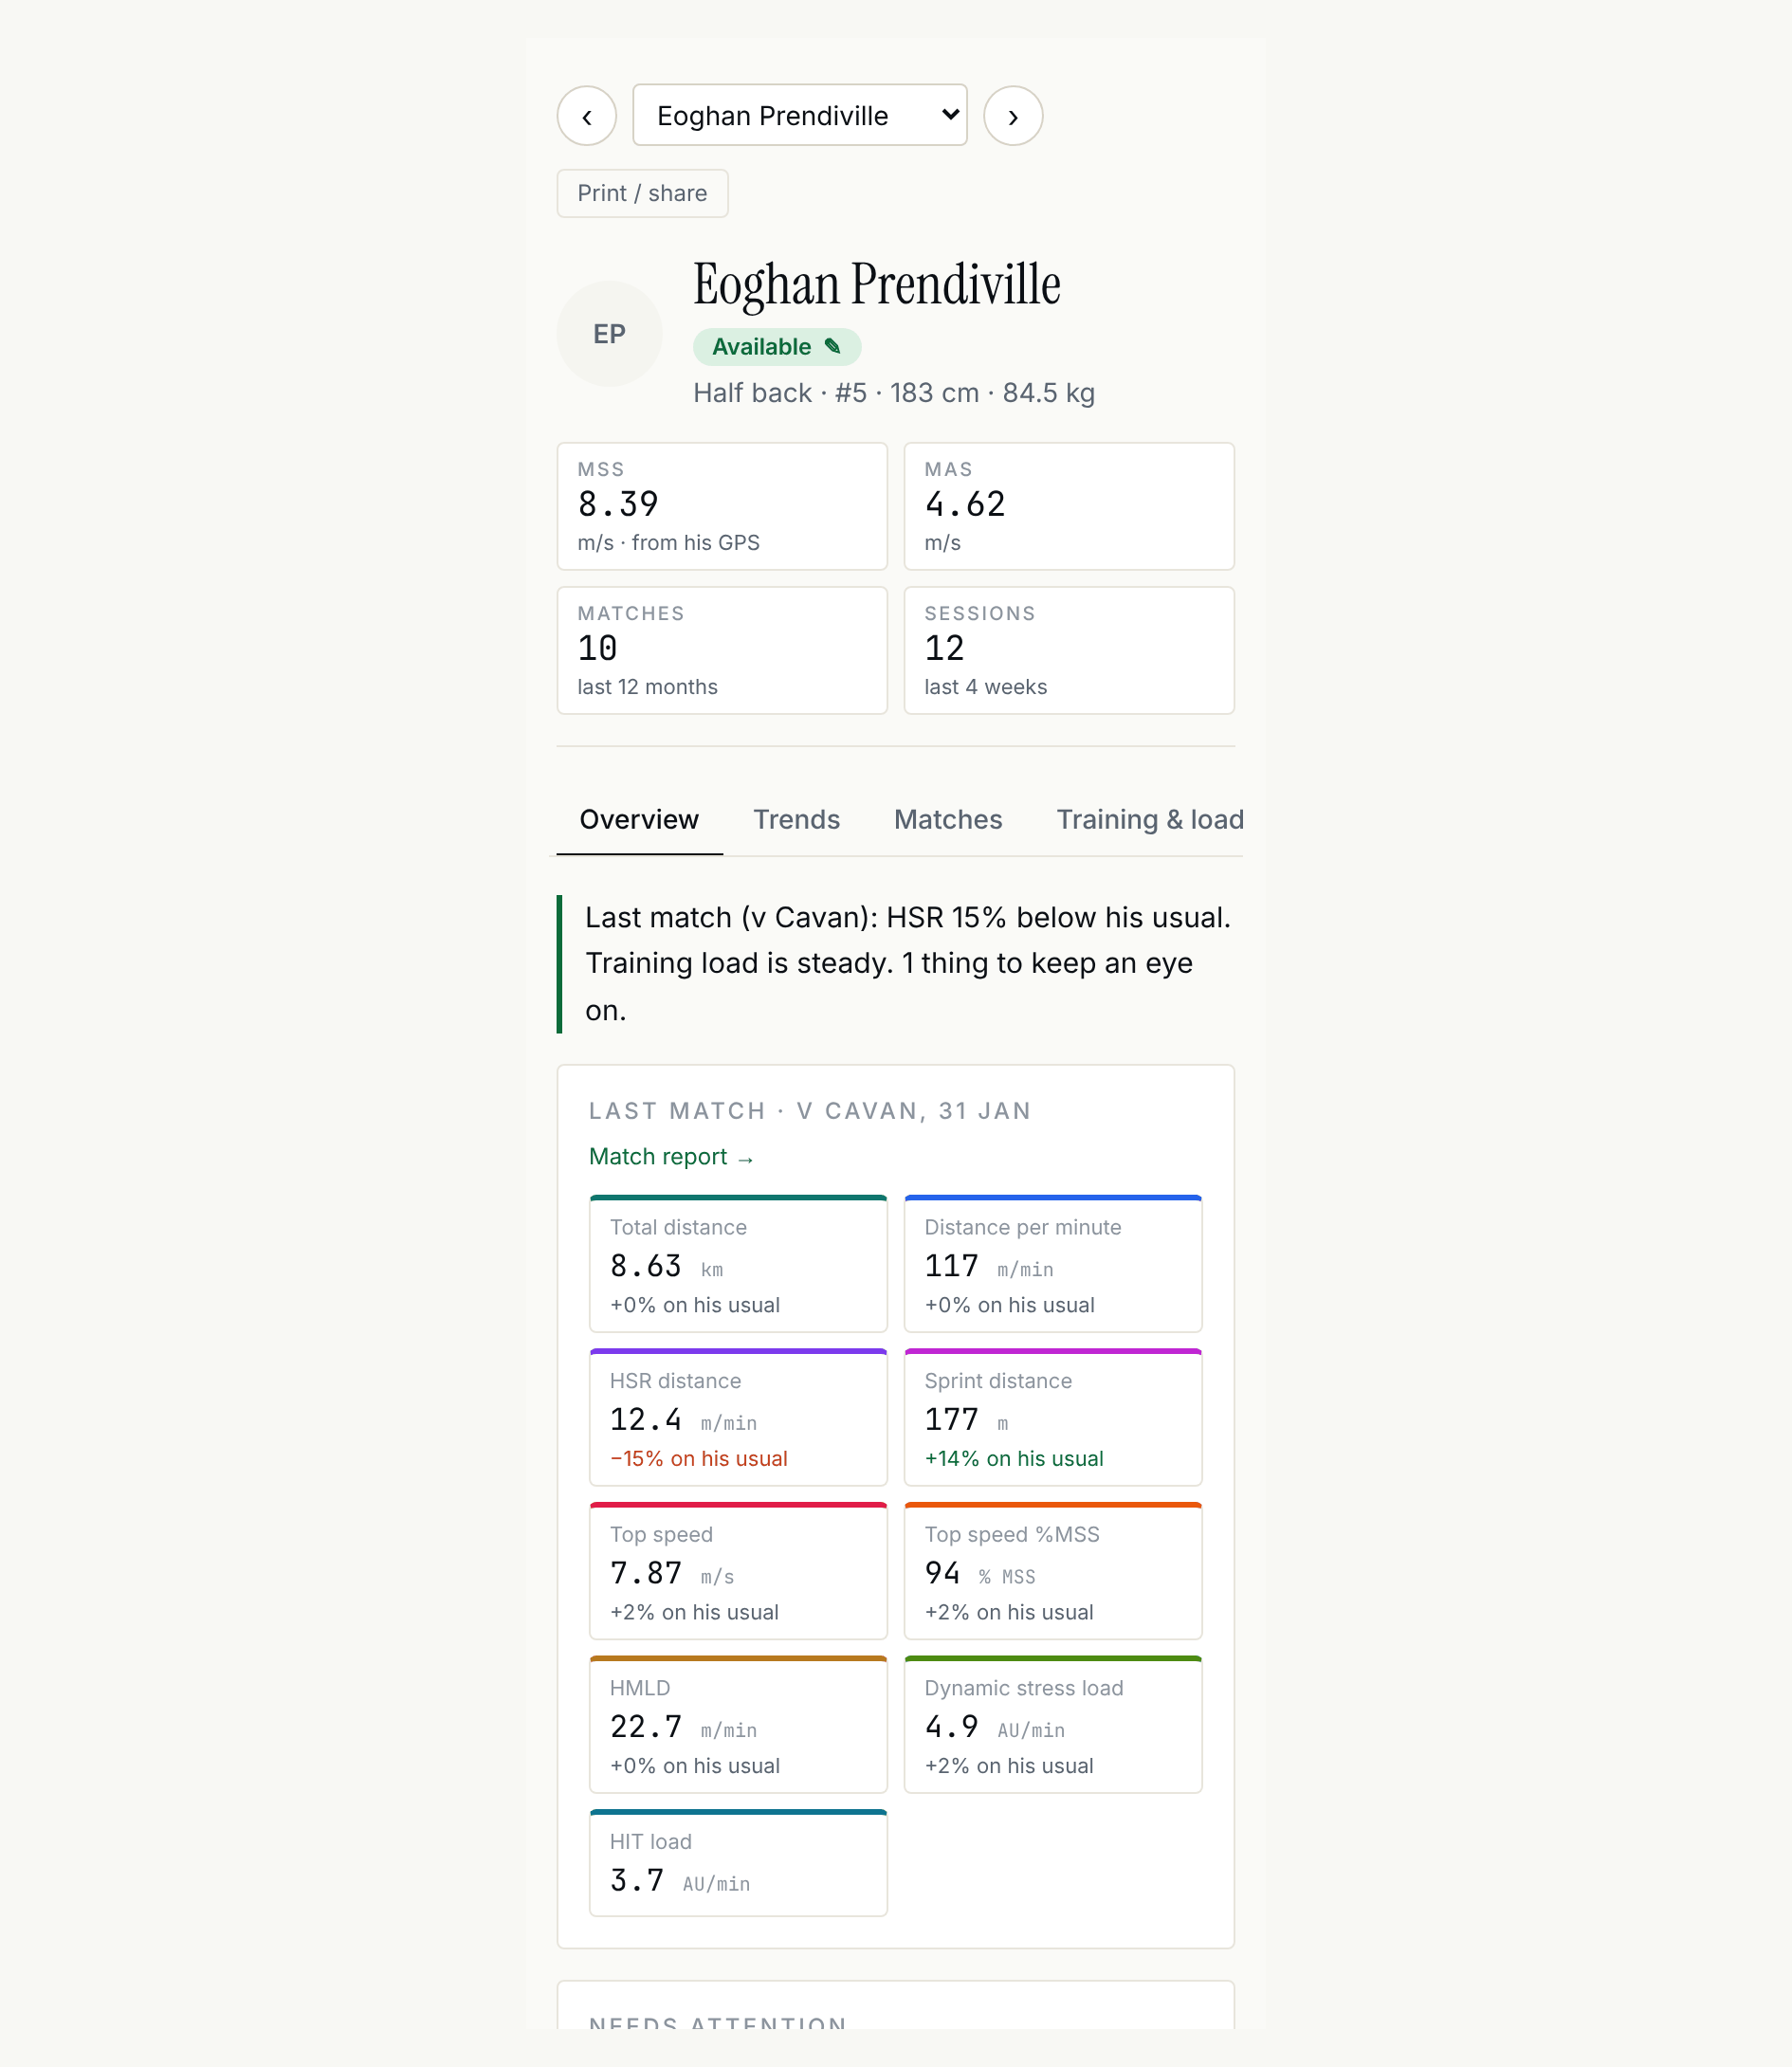
Opening a player now gives one page with tabs. The header has a switcher to move between players, his status (tap it to change availability), and his max speed, MAS, matches and recent sessions.
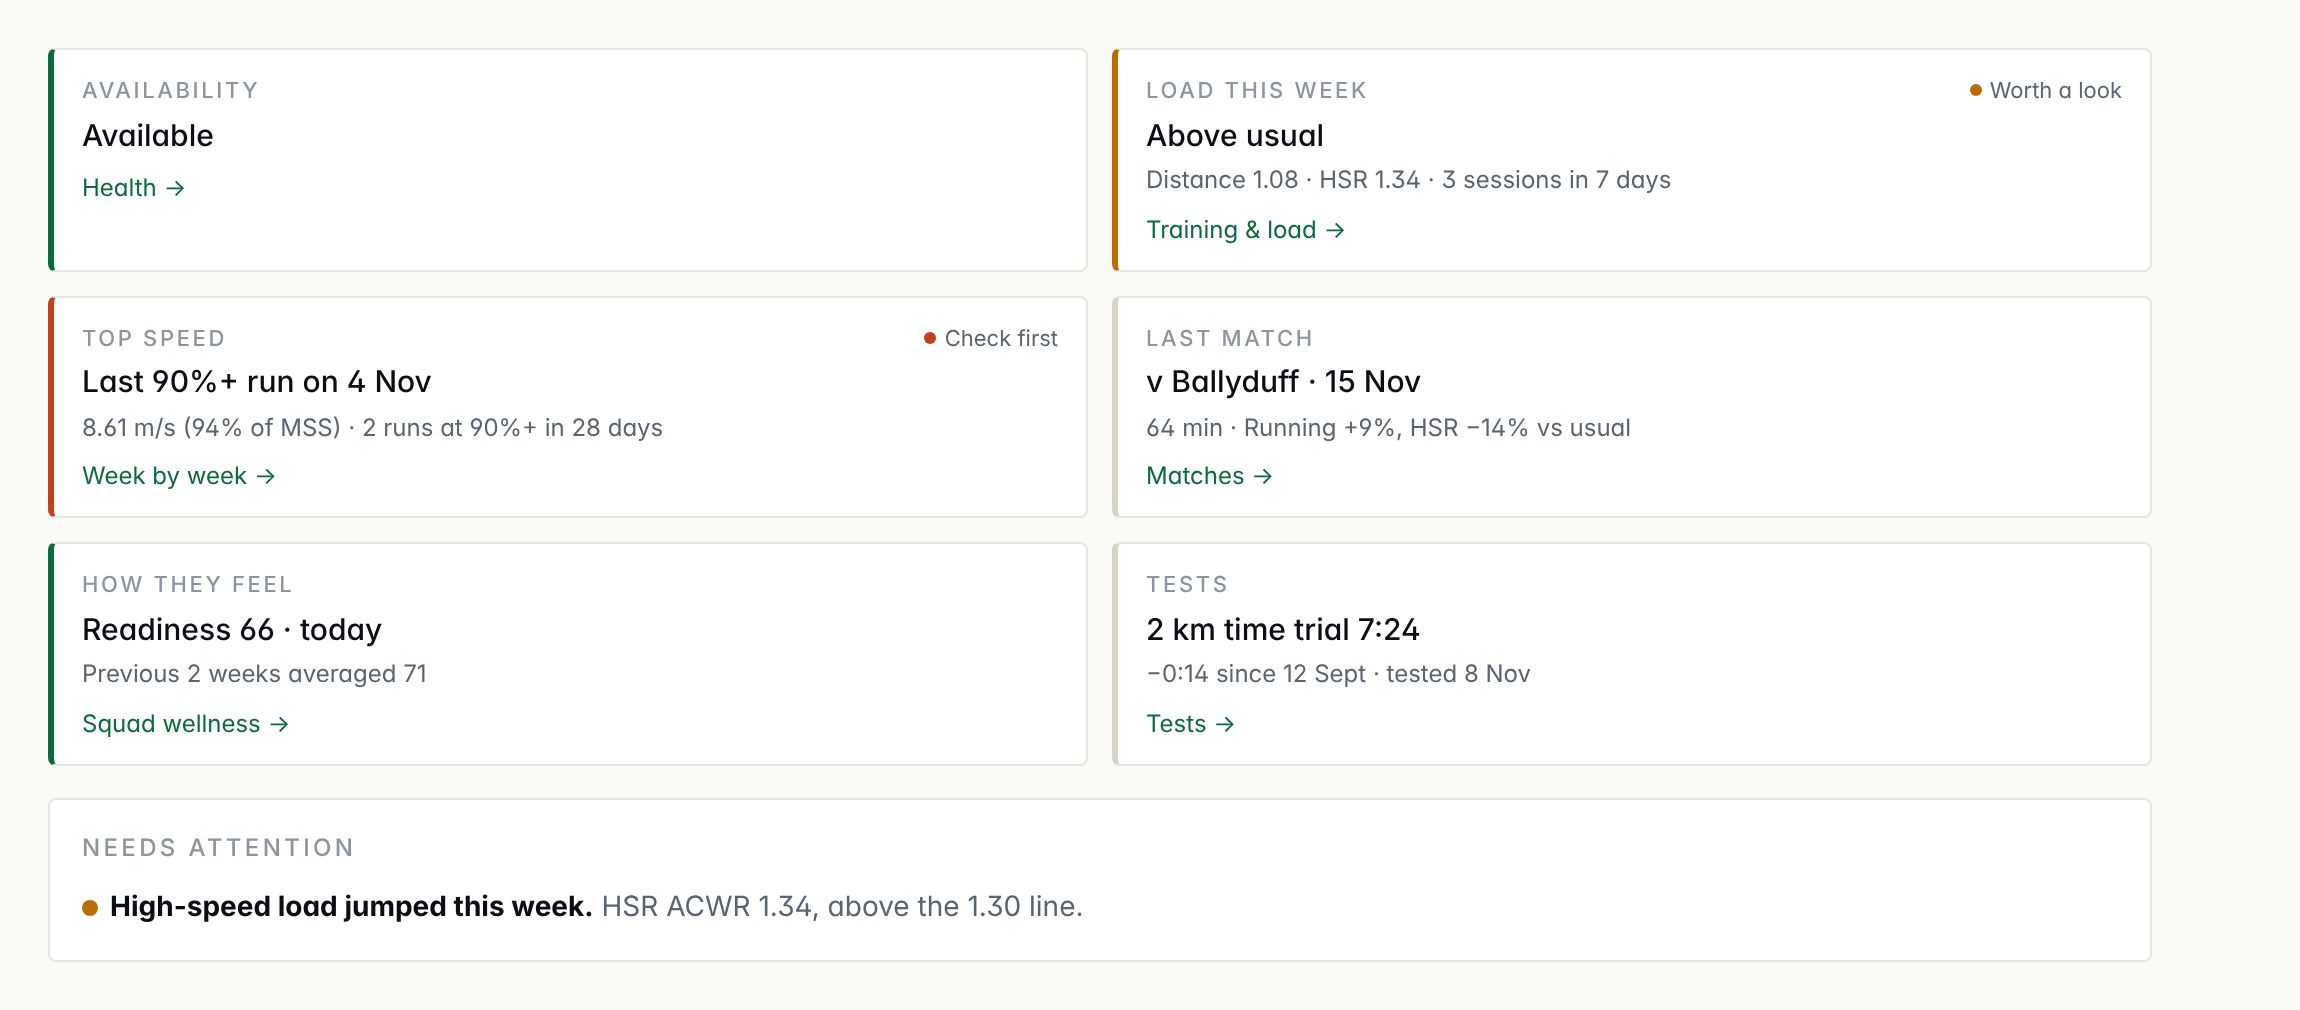
- Overview: a tile for each thing to know before talking to the player — availability (and an injury's return date), load this week against the four before (the Load page's workload bands, distance and high-speed), top speed (when they last ran at 90%+ of MSS, and how often in 28 days), last match against their usual game, how they feel (latest check-in against the previous fortnight) and tests (the latest result and how it moved). A coloured edge marks Worth a look or Check first; tap a tile for the tab with the detail. Underneath, anything that needs attention.
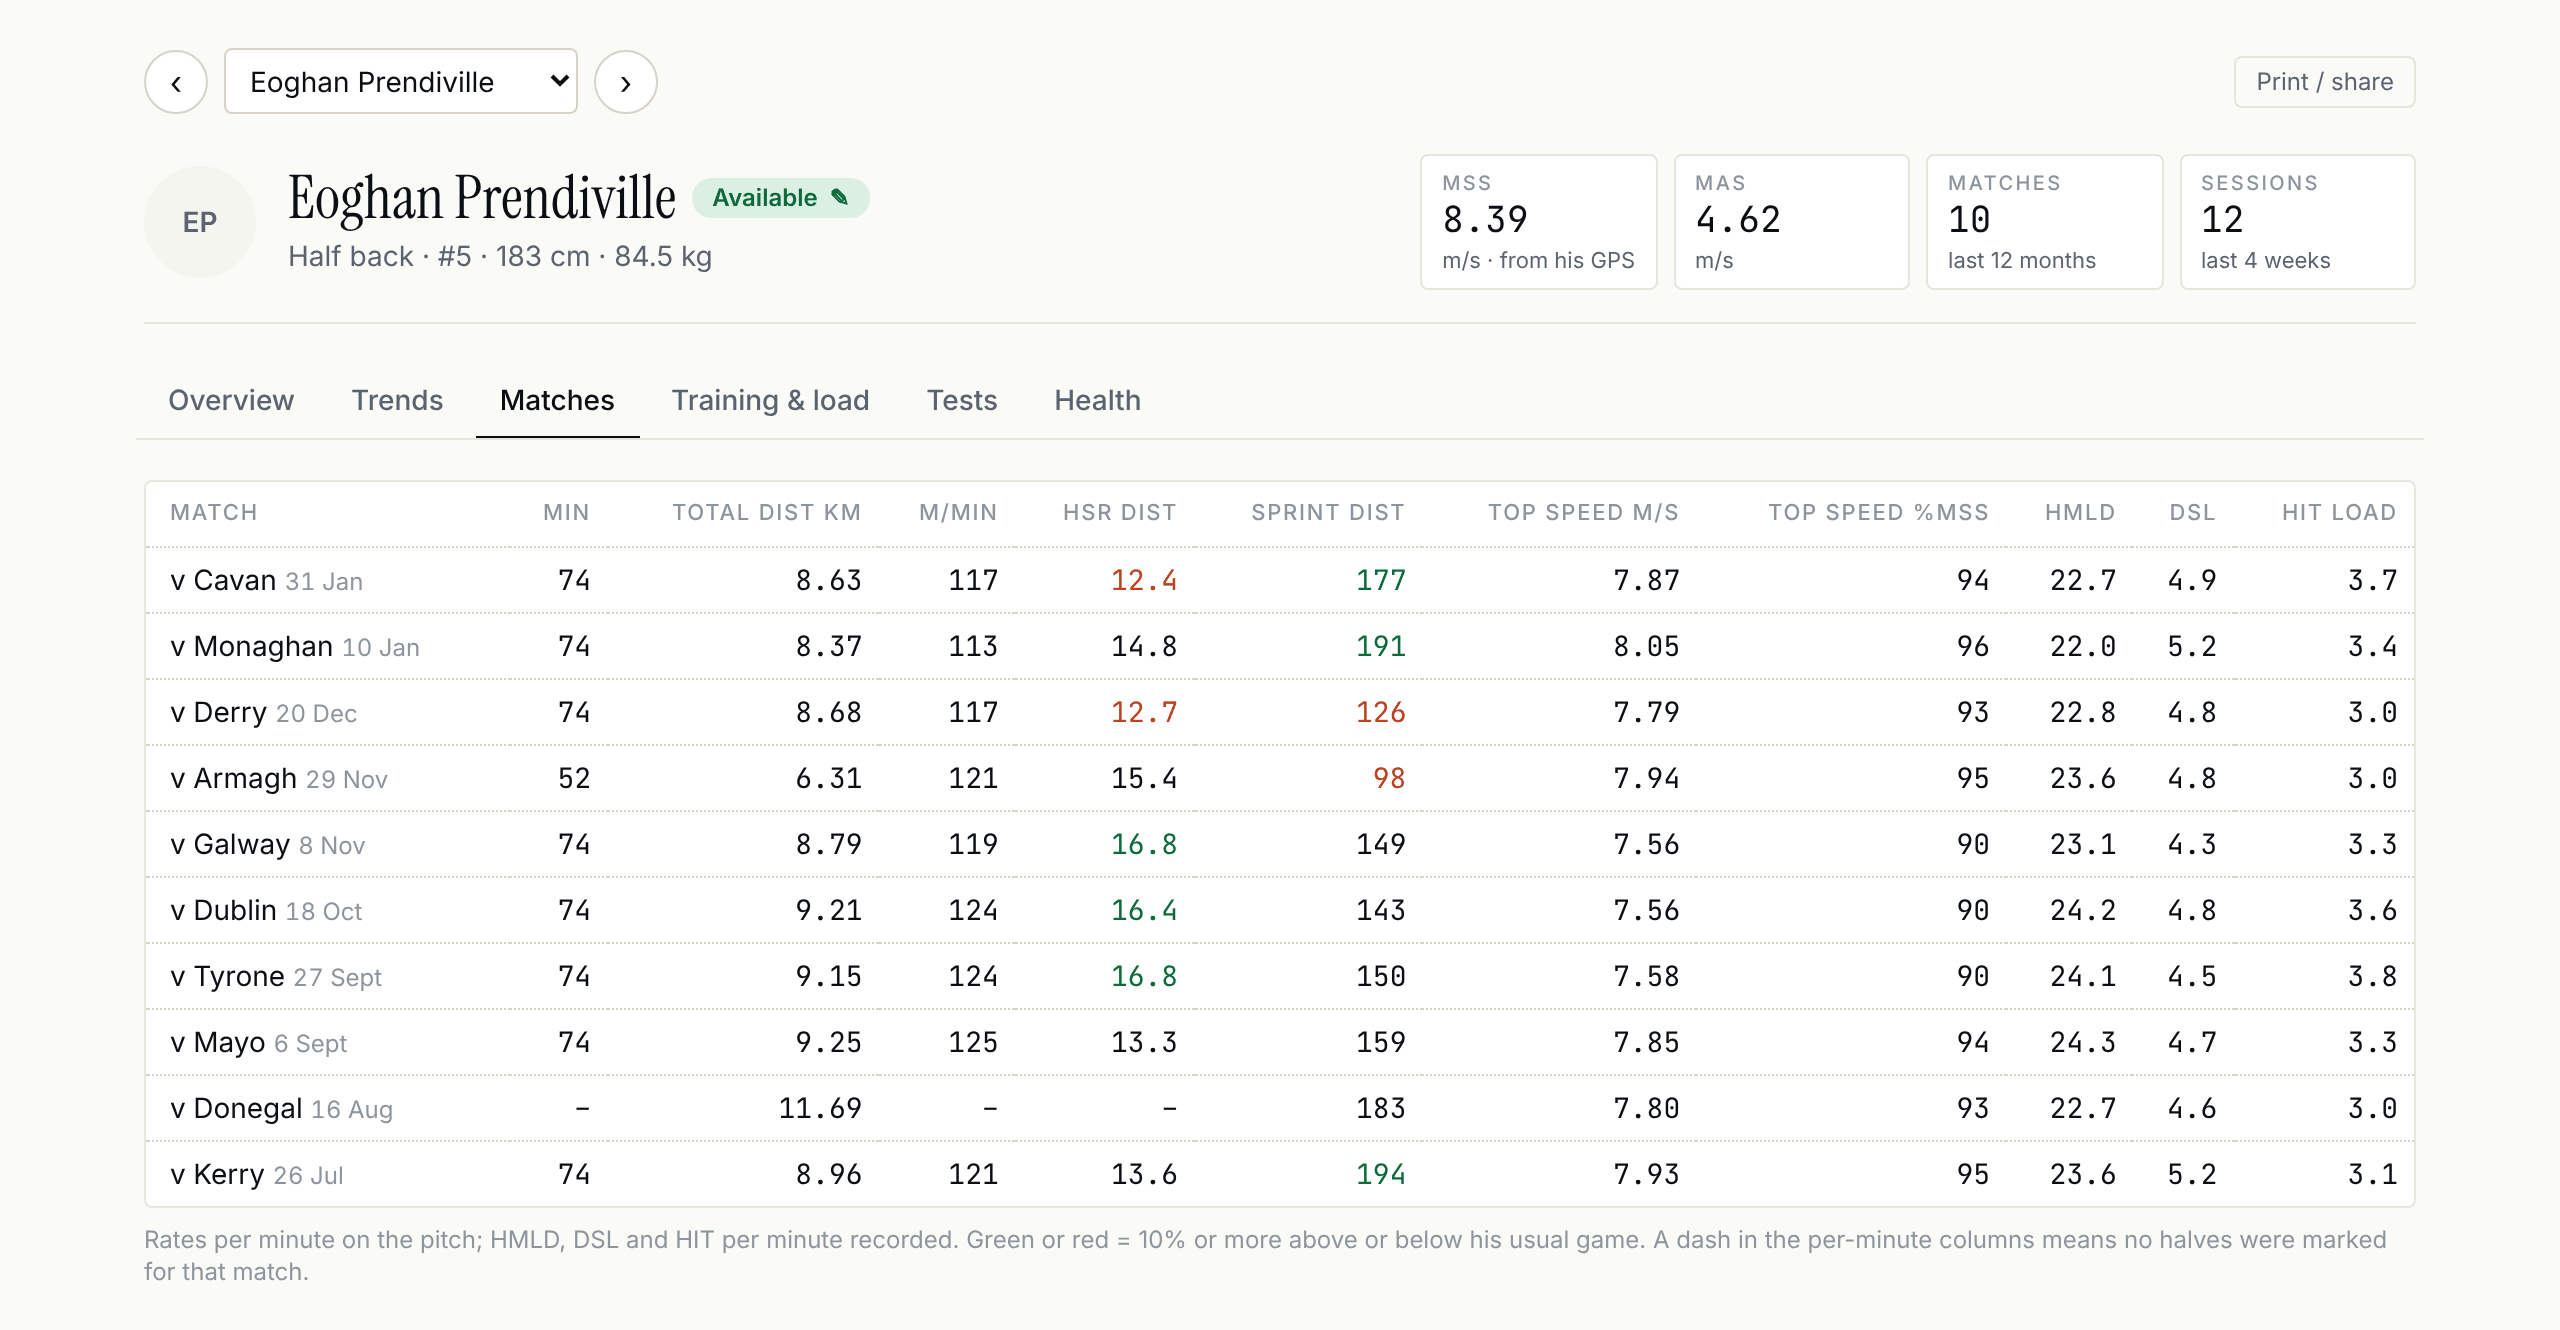
- Matches: one match at a time. Step through them with ‹ › (or the ← →
keys), pick one from the list, or tap a row in the table underneath. For each
match:
- What the game asked: his running, high-speed running, sprint distance, HMLD, DSL and top speed per minute on the pitch, against his usual game, a typical game for his line and a demanding game for his line (the 95th percentile, as on Game demands), with the match as a % of the demanding game.
- By segment: each half side by side, or each quarter when a coach marked them in Match timing, plus extra time.
- Shape of the performance and Session highlights, as on the session page.
- Where they played (clubs on the turning-metrics trial): thirds, channels and running direction for that match, with a link to the movement map.
- Show the session timeline draws the minute-by-minute speed and heart rate only when you ask for it.
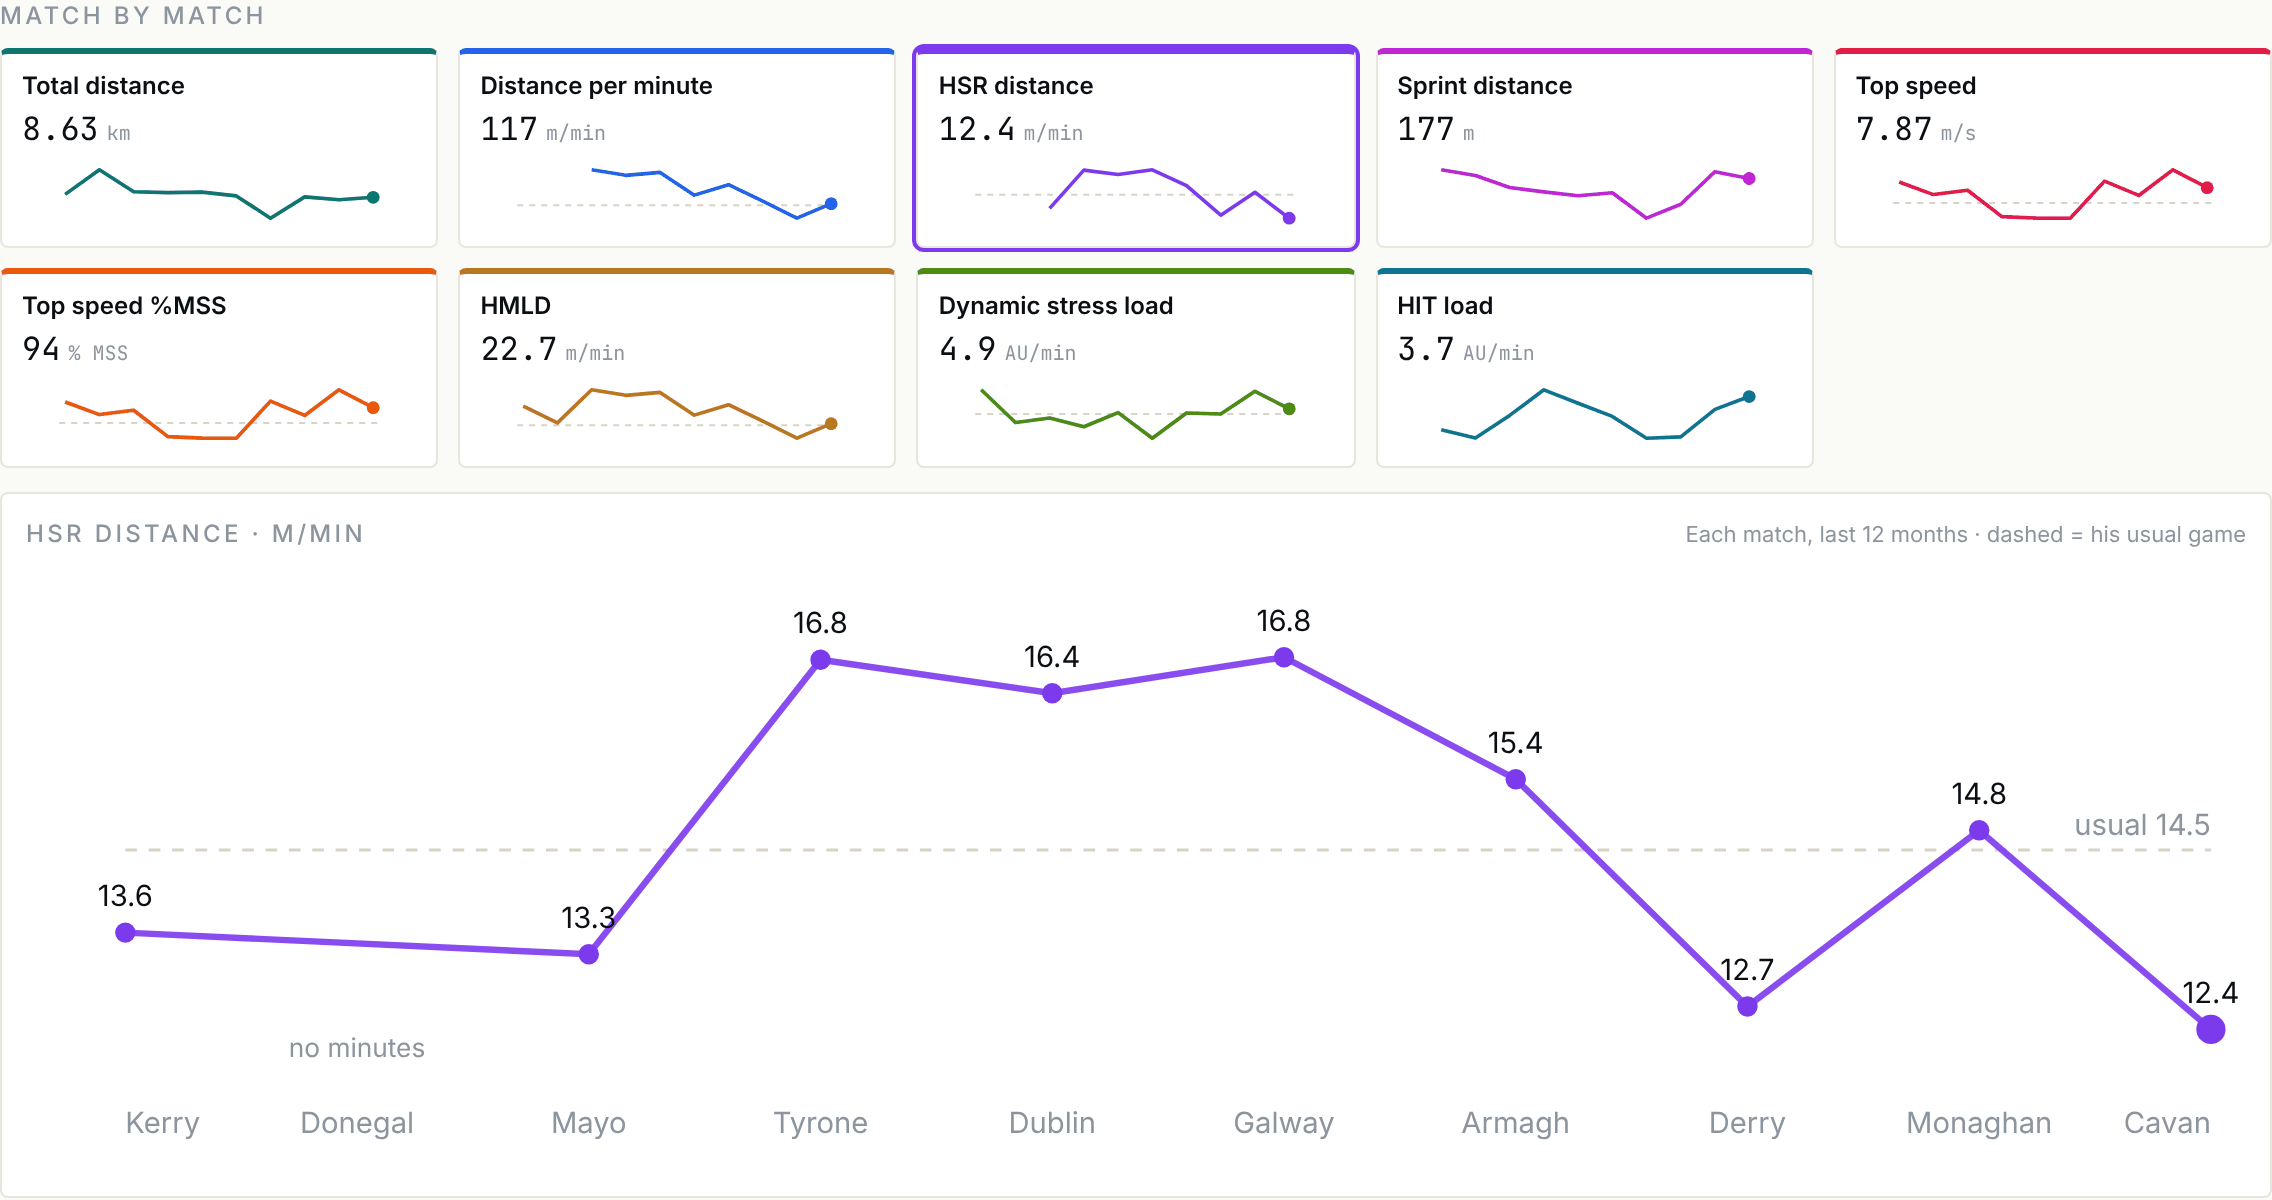
- Underneath, every match coloured where they were 10% or more above or below their usual game, then Match by match: a small chart per metric over the last year with their usual game dashed. Tap one to enlarge it.
- Training & load: session RPE, week by week (sessions, high-speed running, workload ratio and the three fastest runs each week, with a chart of every session), trends over the last 12 weeks, then every session.
- Tests, Health and Gym: what used to be further down the old page.
Print / share opens the existing player profile for a one-to-one conversation.
What hasn't changed
- The old session page is still there: Edit & export on each report opens it, for trimming, splitting, merging and exports.
- No figures changed. The reports read the same numbers as the rest of the app.
- The player app is the same.